 English
  Русский
 Bahasa Indonesia
 Bahasa Malay
 ไทย
ไทย Español
 Deutsch
 Български
 Français
 Tiếng Việt
 中文
中文 বাংলা
বাংলা हिन्दी
 Čeština
 Українська
 Română

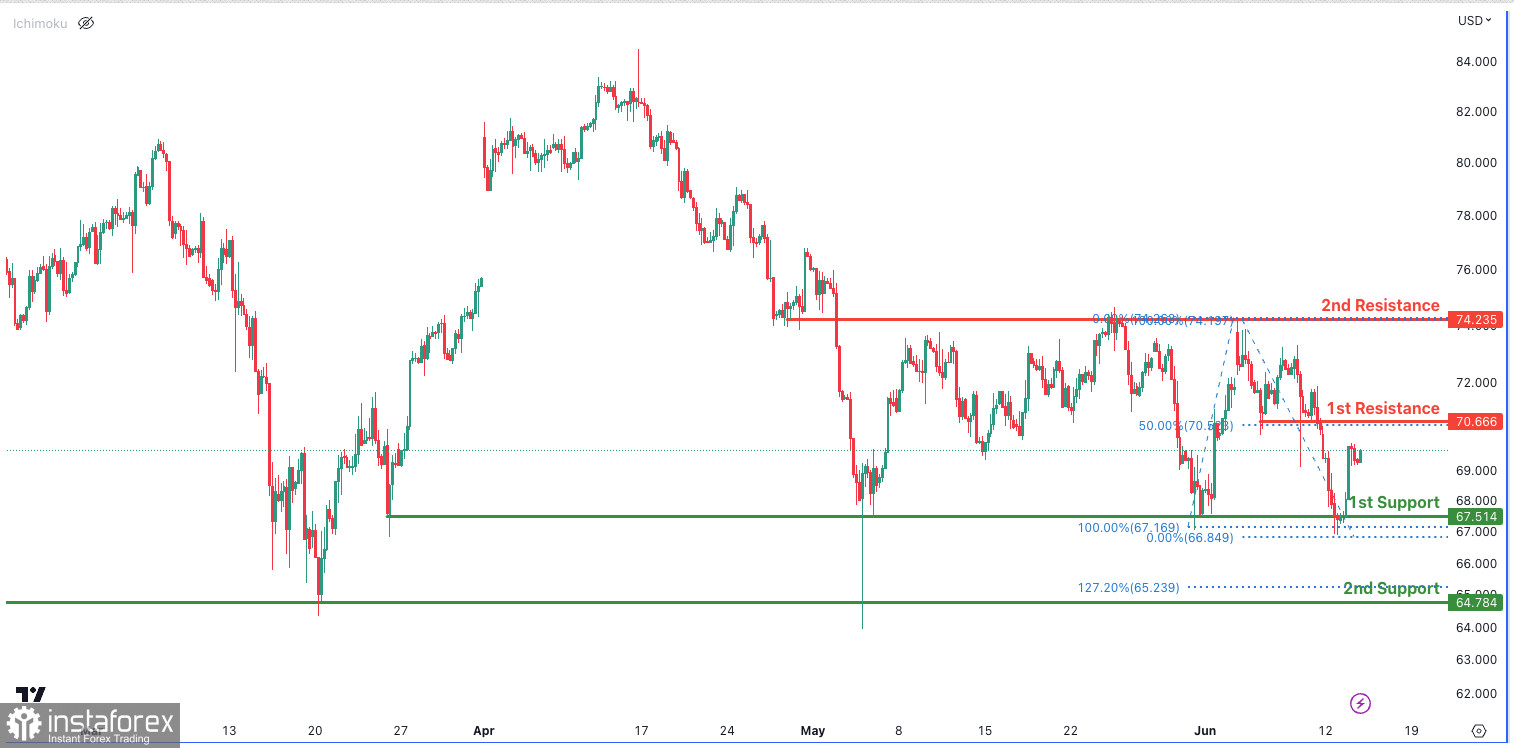
The WTI chart currently exhibits bearish momentum, indicating a downward trend in the market.
There is a potential for the price to respond bearishly at the initial resistance level of 70.66 and decline towards the first support level at 67.51.
Key support levels consist of the first support at 67.51, identified as a multi-swing low support, and the second support at 64.78, which also serves as a multi-swing low support and aligns with the 127.20% Fibonacci Extension level.
On the upside, the first resistance level at 70.66 acts as a pullback resistance and coincides with the 50% Fibonacci Retracement level.
Furthermore, the second resistance level at 74.23 is an area of overlap resistance that should be monitored closely.