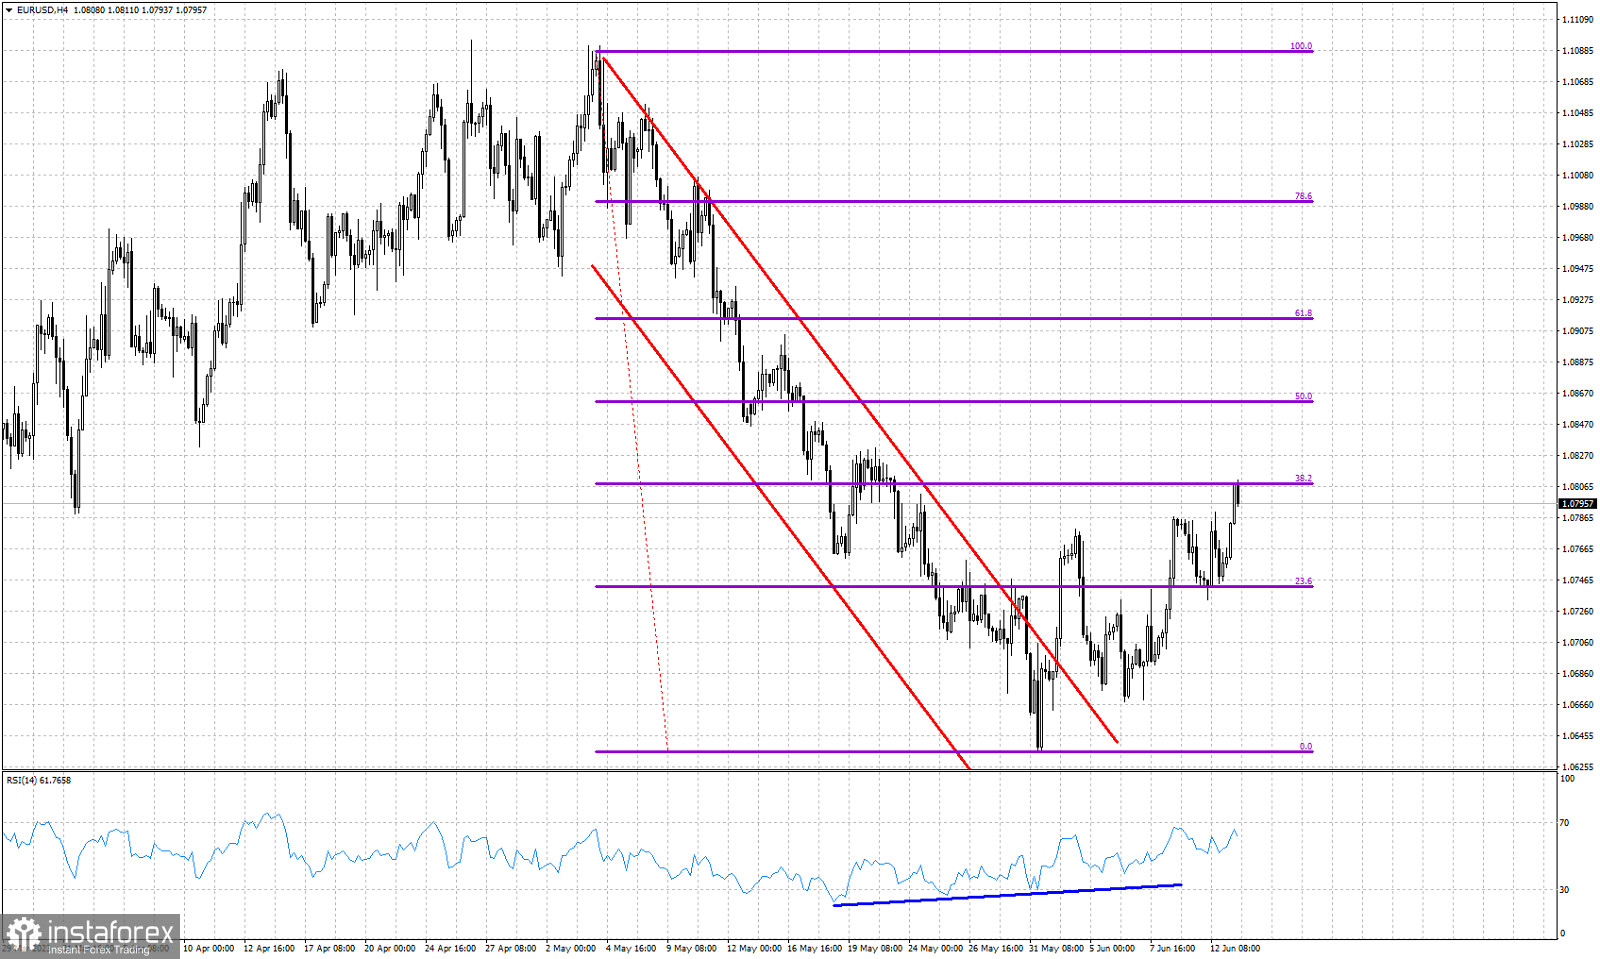
Violet lines- Fibonacci retracement level
Red lines- bearish channel (broken)
Blue line- bullish RSI divergence
In previous posts using the Ichimoku cloud indicator we noted the change in short-term trend from bearish to bullish. Technically we got the same message when price broke out of the bearish channel it was in. After the break out, price pulled back to form a higher low at 1.0667. Price continues making higher highs and higher lows. Short-term trend technically remains bullish. Price reached earlier today the 38% Fibonacci retracement level. This is short-term resistance. The rejection at 1.08 was justified. The RSI is making higher highs and higher lows and has still not reached overbought levels. Despite the pause in the advance, I expect EURUSD to continue higher over the coming sessions.
 English
 Русский
 Bahasa Indonesia
 Bahasa Malay
 ไทย
ไทย Español
 Deutsch
 Български
 Français
 Tiếng Việt
 中文
中文 বাংলা
বাংলা हिन्दी
 Čeština
 Українська
 Română

