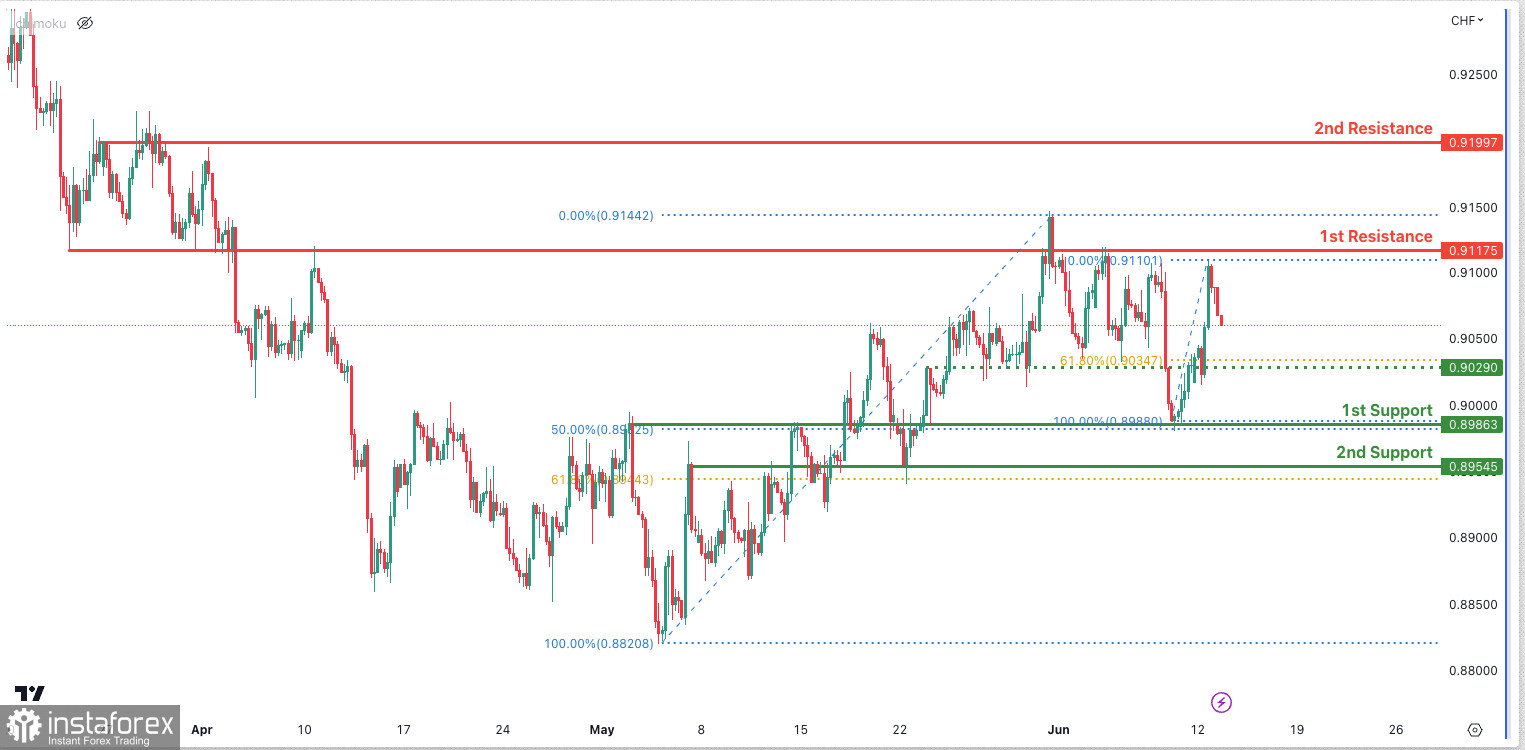
The USD/CHF chart shows bearish momentum, indicating a downward bias in price movement.
There is potential for further bearish continuation towards the first support level at 0.8986, which is an area of overlap support and is reinforced by a 50% Fibonacci retracement level. Additionally, the intermediate support level at 0.9029 aligns with the 61.8% Fibonacci retracement, further supporting its role as a potential barrier.
Furthermore, the second support level at 0.8955 adds to the strength of the downward momentum. It represents another area of overlap support and coincides with the 61.80% Fibonacci retracement level.
On the upside, the first resistance level at 0.9118 acts as a significant level of resistance, serving as an area of overlap resistance.
Similarly, the second resistance level at 0.9200 reinforces the potential for resistance, also representing an area of overlap resistance.
 English
 Русский
 Bahasa Indonesia
 Bahasa Malay
 ไทย
ไทย Español
 Deutsch
 Български
 Français
 Tiếng Việt
 中文
中文 বাংলা
বাংলা हिन्दी
 Čeština
 Українська
 Română

