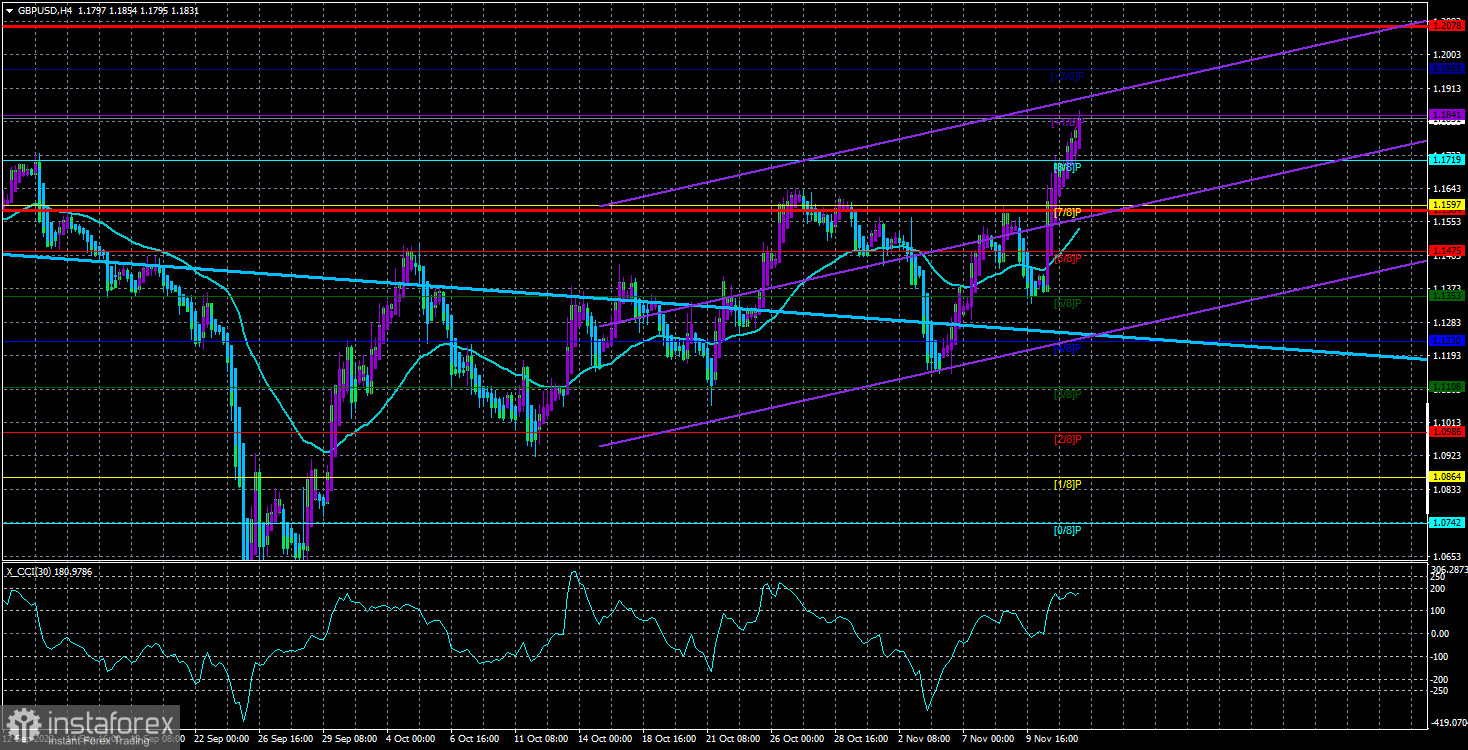
The GBP/USD pair edged higher on Friday despite the UK's disappointing GDP results and slightly better-than-expected industrial production. Meanwhile, the market is still digesting the US inflation report, which triggered a mass sell-off in the US dollar. It may well be that fundamental factors are now weighing on the market. Over the past several weeks, the pound has been trying to make a buy signal, which happened eventually. In the H4 time frame, we now have one linear regression channel at least. In the H24 time frame, the price settled above the Ichimoku cloud. The pair now has growth prospects, although fundamental and geopolitical factors reflect the opposite situation.
Nevertheless, we accept that the market can move based solely on technical factors. As a reminder, GBP has been bearish for about a year and a half. Therefore, the market may now be in a phase where short positions are actively closed, resulting in a weaker US dollar. In the near term, the Federal Reserve may abandon further rate hikes, and US inflation only brings that moment closer. In terms of fundamental factors, this may also be seen as a reason behind the pair's growth. Anyway, we believe that the long-term downtrend may resume.
UK GDP falls by 0.6% in Q3
On Friday, the United Kingdom saw the release of Q3 GDP. Notably, the market showed little interest in the report, even if a reaction of 20-30 pips followed. At the same time, it kept digesting US inflation data that came the day before. Anyway, the British economy contracted by 0.6% q/q in the third quarter of the year, slightly up from market expectations of 0.5%. The Bank of England Governor, Andrew Bailey, said that Q3 would become the first quarter in a row with negative GDP. Therefore, the more the economy contracts, the less will be the pound's chance to extend the uptrend. However, judging by the market situation, the GDP results seem to have been of little interest.
Instead, the market focuses on interest rates. Here it is important to understand how it interprets the situation. Traders ignored seven of the BoE's rate hikes. However, with a possible change in the Federal Reserve's stance, everything may be different. The market is quite often driven by expectations. And now the Federal Reserve is expected to reduce the pace of tightening, while the Bank of England is not. That means the pound may ignore the Fed's rate increases from now on, just like it used to disregard the BoE's.
In our view, both the pound and the euro may begin to fall if the geopolitical situation deteriorates.

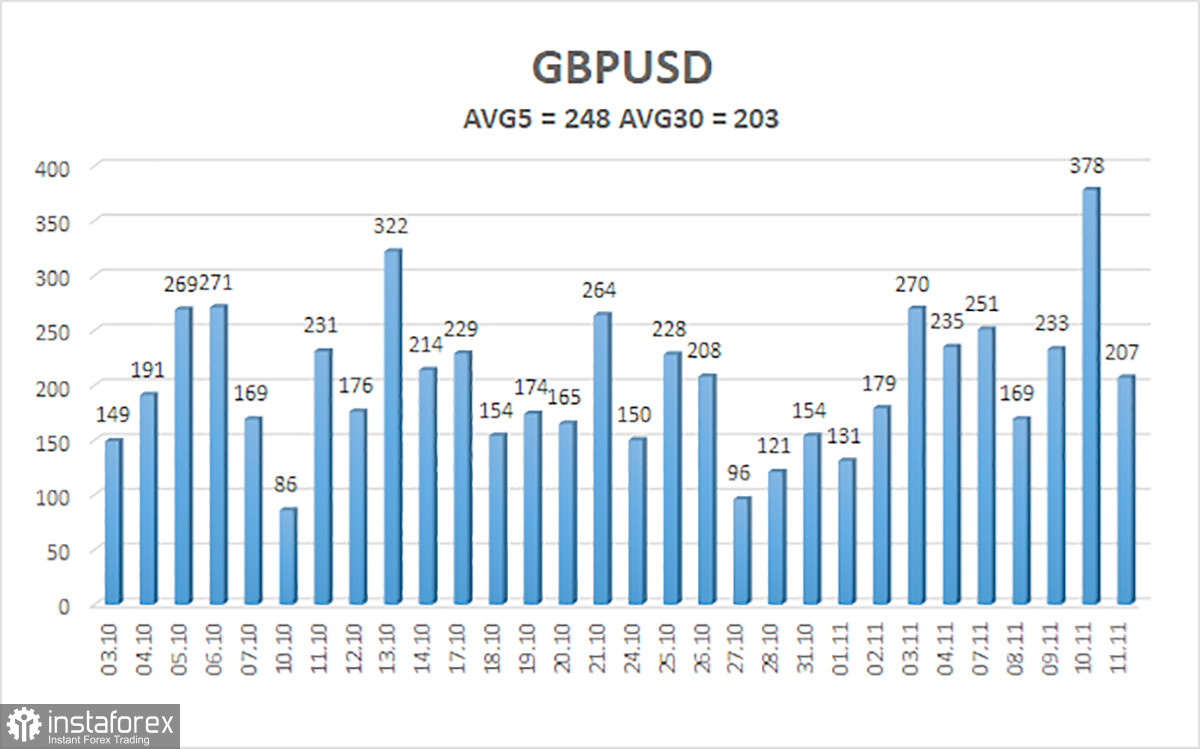
On November 14th, the 5-day average volatility of GBP/USD totals 248 pips and is evaluated as extremely high. On Monday, the pair is expected to move in a channel limited by the 1.1584 and 1.2078 levels. Heiken Ashi's downward reversal will mark the beginning of a correction.
Closest support levels:
S1 – 1.1719
S2 – 1.1597
S3 – 1.1475
Closest resistance levels:
R1 – 1.1841
R2 – 1.1963
Outlook:
The GBP/USD pair keeps moving north in the H4 time frame. So, long positions could be held with targets at 1.1963 and 1.2078 until Heiken Ashi reverses to the downside. Short positions could be considered after consolidation below the moving average with targets at 1.1475 and 1.1353.
Indicators on charts:
Linear Regression Channels help identify the current trend. If both channels move in the same direction, a trend is strong.
Moving Average (20-day, smoothed) defines the short-term and current trends.
Murray levels are target levels for trends and corrections.
Volatility levels (red lines) reflect a possible price channel the pair is likely to trade in within the day based on the current volatility indicators.
CCI indicator. When the indicator is in the oversold zone (below 250) or in the overbought area (above 250), it means that a trend reversal is likely to occur soon.
 English
 Русский
 Bahasa Indonesia
 Bahasa Malay
 ไทย
ไทย Español
 Deutsch
 Български
 Français
 Tiếng Việt
 中文
中文 বাংলা
বাংলা हिन्दी
 Čeština
 Українська
 Română

