Tomorrow, the US and Canada are celebrating national holidays, US banks and stock exchanges will be closed, and on the eve of the long weekend, strong movements may be observed in the market, provoked by the fixation of some of the trading positions of traders.
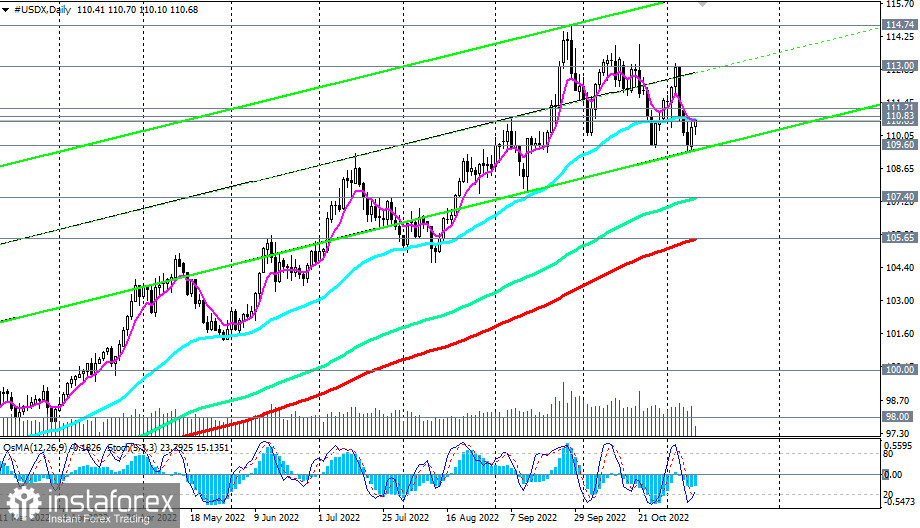
If today's publication of US inflation figures will disappoint investors, it will cause a new wave of dollar sales and a drop in DXY towards support levels 109.60, 109.00. The breakout of these levels may provoke a deeper fall of the DXY, up to key support levels 107.40 (144 EMA on the daily chart), 105.65 (200 EMA on the daily chart).

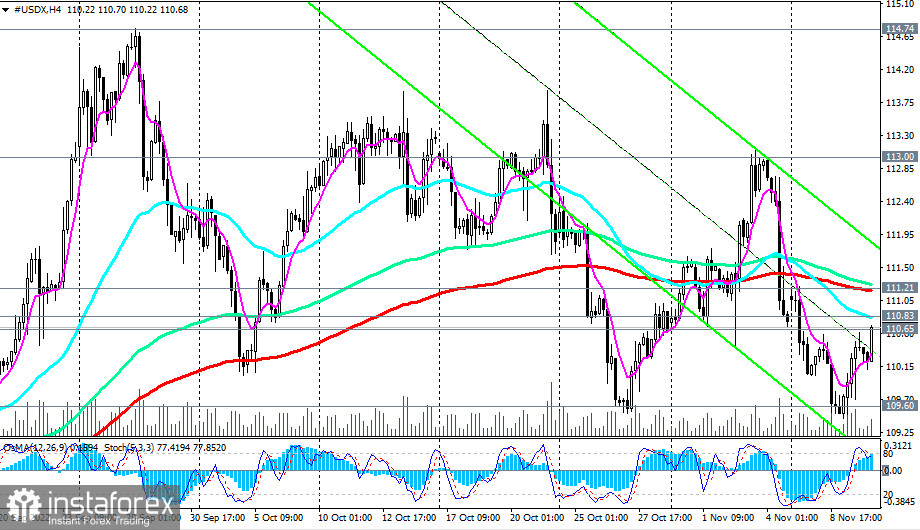
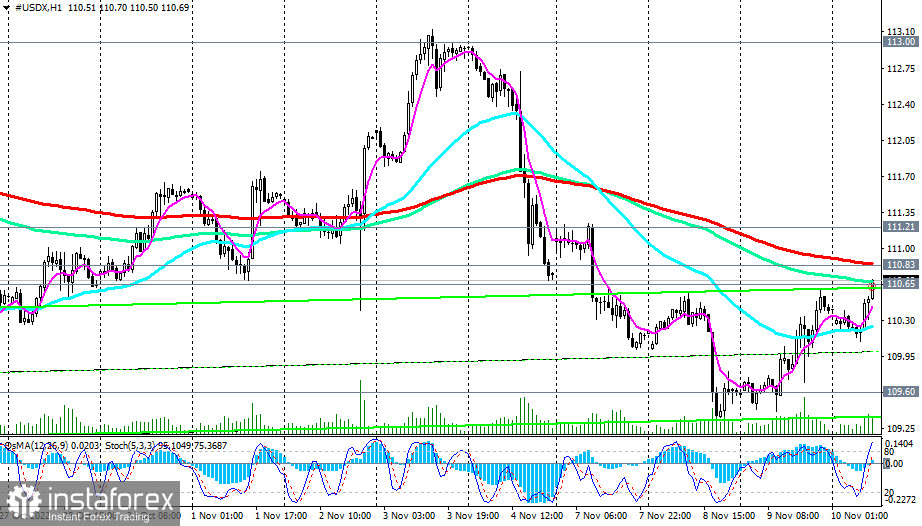
Therefore, while CFD #USDX remains in the zone of the long-term bull market, long positions still look preferable. However, a signal is also needed to resume them. The first such signal will be the breakout of an important short-term resistance level at 110.83 (200 EMA on the 1-hour chart), and the confirmation signal will be the breakout of an important, also short-term, resistance level 111.21 (200 EMA on the 4-hour chart). The nearest growth target is the local resistance level 113.00.

Support levels: 109.60, 109.00, 107.40, 105.65
Resistance levels: 110.83, 111.21, 112.00, 113.00, 114.00, 114.74, 115.00
Trading Tips
Sell Stop 109.90. Stop Loss 110.90. Take Profit 109.60, 109.00, 107.40, 105.70
Buy Stop 110.90. Stop-Loss 109.90. Take-Profit 111.20, 112.00, 113.00, 114.00, 114.74, 115.00
 English
 Русский
 Bahasa Indonesia
 Bahasa Malay
 ไทย
ไทย Español
 Deutsch
 Български
 Français
 Tiếng Việt
 中文
中文 বাংলা
বাংলা हिन्दी
 Čeština
 Українська
 Română

