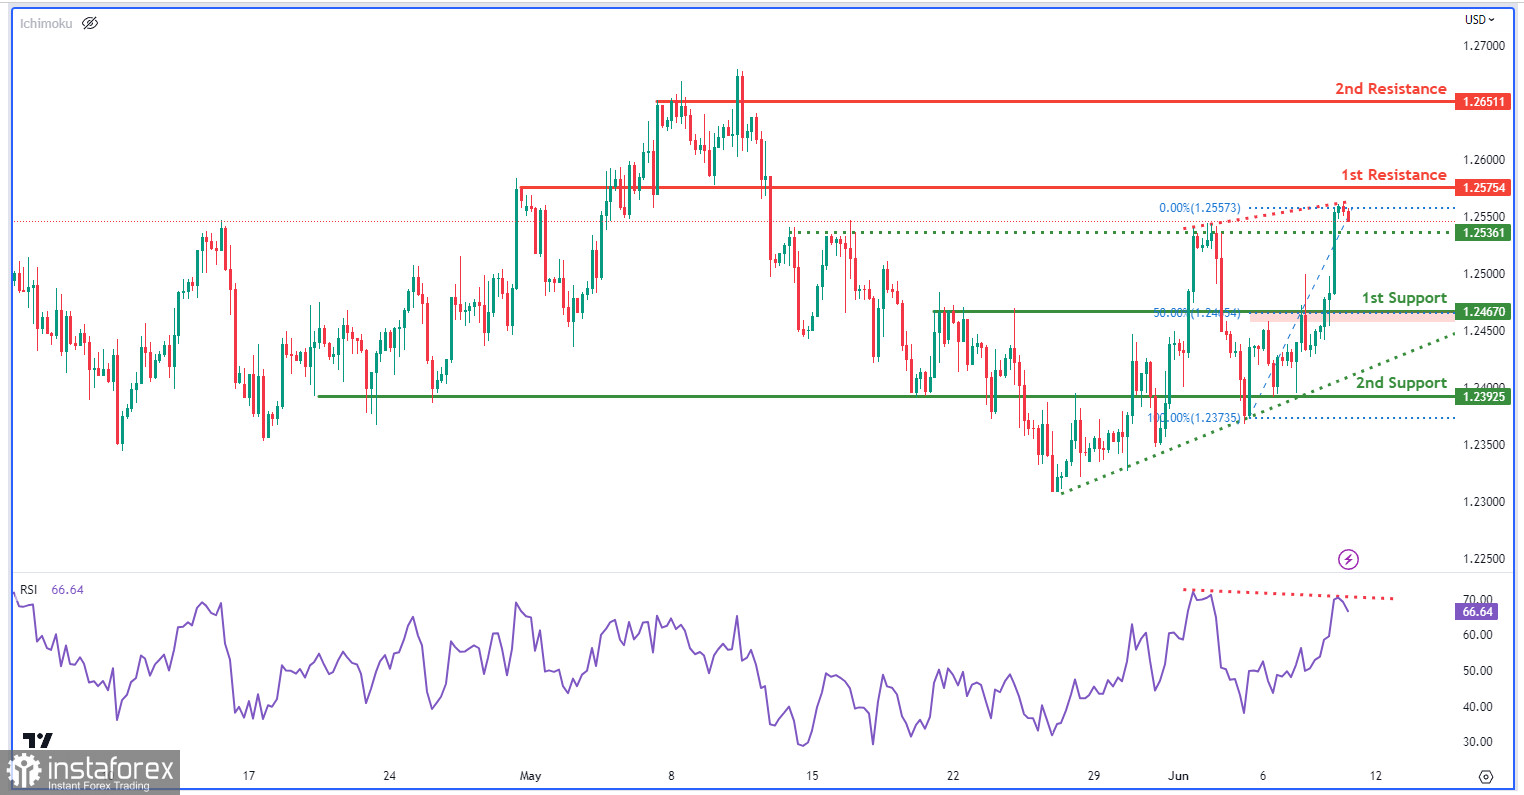
The GBP/USD chart shows a bearish momentum, but there is a major ascending trend line that suggests possible bullish momentum ahead. In the short term, the price may drop to the first support at 1.2467, which is a significant level with pullback support and Fibonacci retracement. The second support at 1.2392 also provides additional support. On the upside, the first resistance at 1.2575 and the second resistance at 1.2651 act as pullback resistance levels. The RSI shows bearish divergence, hinting at a potential reversal.
 English
 Русский
 Bahasa Indonesia
 Bahasa Malay
 ไทย
ไทย Español
 Deutsch
 Български
 Français
 Tiếng Việt
 中文
中文 বাংলা
বাংলা हिन्दी
 Čeština
 Українська
 Română

