Analysis of EUR/USD, 5-minute chart

Yesterday, the euro/dollar pair finally began to move down after several days of illogical and groundless growth. The euro fell by only 80-90 points, which is certainly not enough for us to talk about a new short-term downward trend. Today the pair may shoot up again if the US inflation report turns out to be very good. And in order for it to be very good, the consumer price index should fall by more than 0.3% y/y. Moreover, the dollar's fall in this case will be logical, but this does not mean at all that the market will react in this way to such data. In recent days, and even last week, we have hardly seen movement that can be considered logical. The overall technical picture is more and more like a "swing". Formally, the euro has certain grounds to continue rising. At least because it overcame the Ichimoku cloud on the 24-hour timeframe. But from the point of view of the foundation, it is still difficult to believe that the euro would sharply rise.
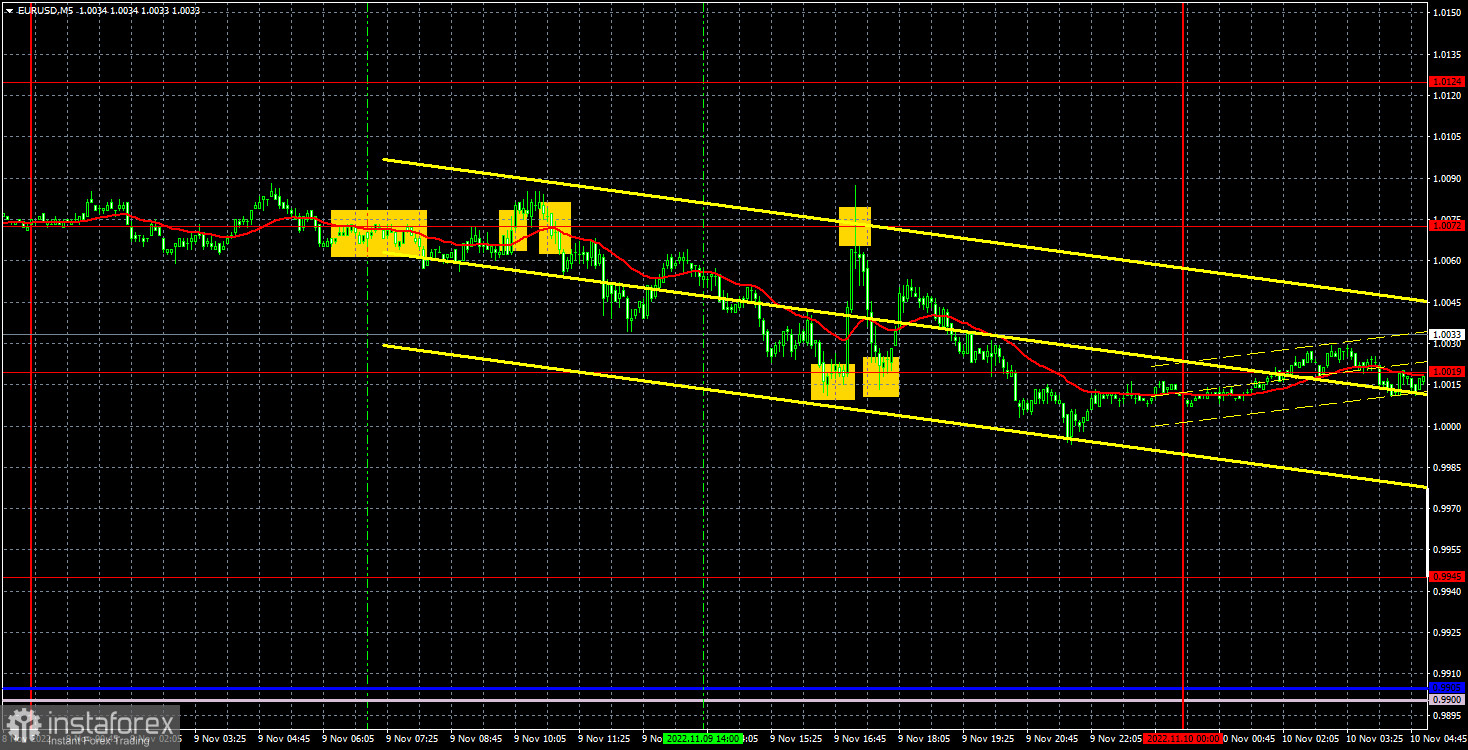
In regards to Wednesday's trading signals, the situation on the 5-minute timeframe was not the best. Two false signals were formed near the level of 1.0072 during the European trading session. Both traders could work out and both received a loss, since neither in the first nor in the second cases the price managed to move even 15 points in the right direction. Therefore, the third sell signal should have been ignored, but it just turned out to be correct. Then a buy signal formed around 1.0019, but the pair began to grow so rapidly that it was already a difficult task to enter the market in time. However, about 20 pips could be earned on this. The new bounce from 1.0072 was to be ignored. And the last long position from the level of 1.0019 was closed by Stop Loss. As a result, the day ended with a minimal loss.
COT report

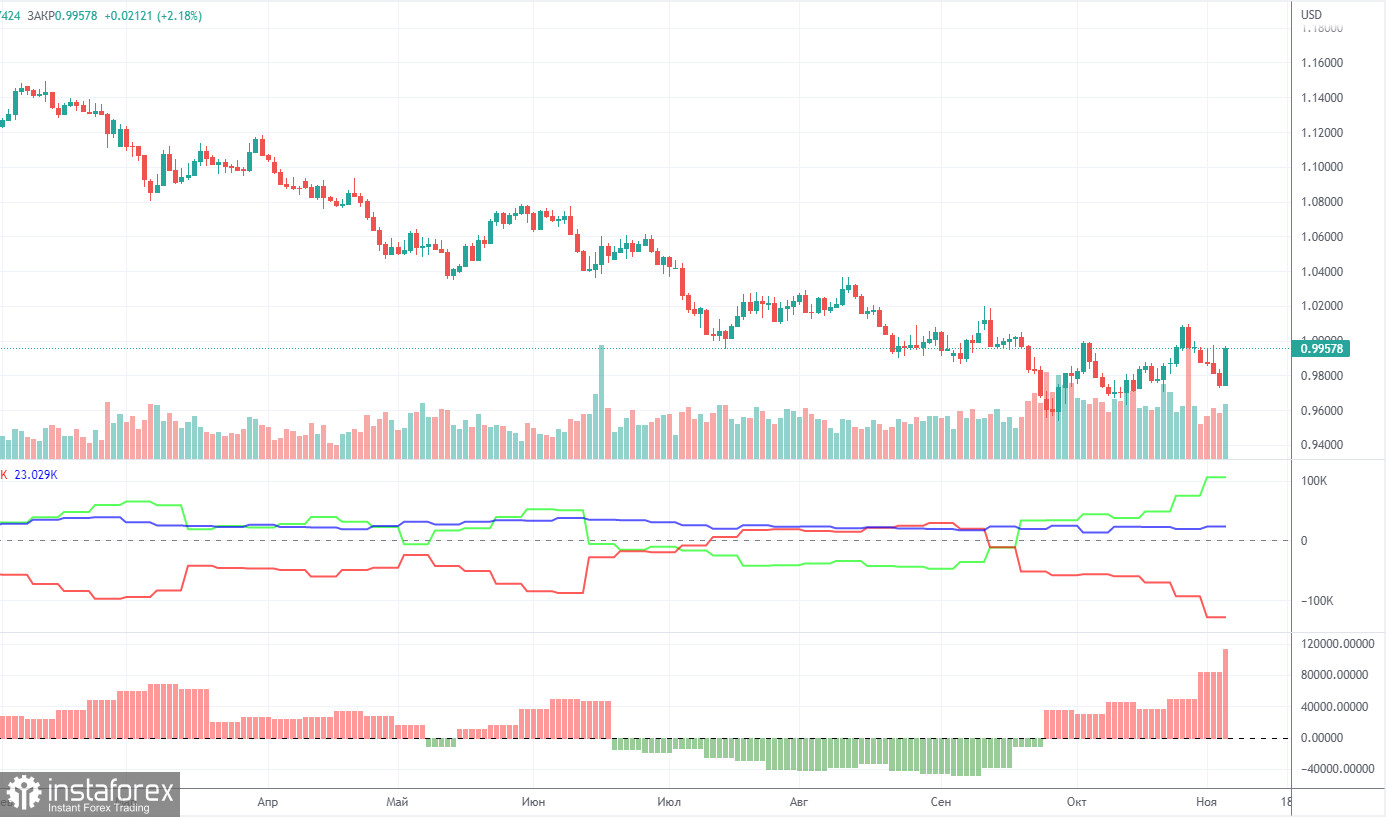
In 2022, the Commitment of Traders (COT) report for the euro is becoming more and more interesting. In the first part of the year, the reports were pointing to the bullish sentiment among professional traders. However, the euro was confidently losing value. Then, for several months, reports were reflecting bearish sentiment and the euro was also falling. Now, the net position of non-commercial traders is bullish again. The euro managed to rise above its 20-year low, adding 500 pips. This could be explained by the high demand for the US dollar amid the difficult geopolitical situation in the world. Even if demand for the euro is rising, high demand for the greenback prevents the euro from growing.
In the given period, the number of long positions initiated by non-commercial traders increased by 13,000, whereas the number of short orders declined by 17,000. As a result, the net position increased by 30,000 contracts. However, this could hardly affect the situation since the euro is still at the bottom. The second indicator in the chart above shows that the net position is now quite high, but a little higher there is a chart of the pair's movement itself and we can see that the euro again cannot benefit from this seemingly bullish factor. The number of longs exceeds the number of shorts by 106,000, but the euro is still trading low. Thus, the net position of non-commercial traders may go on rising without changing the market situation. If we look at the overall indicators of open longs and shorts across all categories of traders, then there are 23,000 more shorts (617,000 vs 594,000).
Analysis of EUR/USD, 1-hour chart

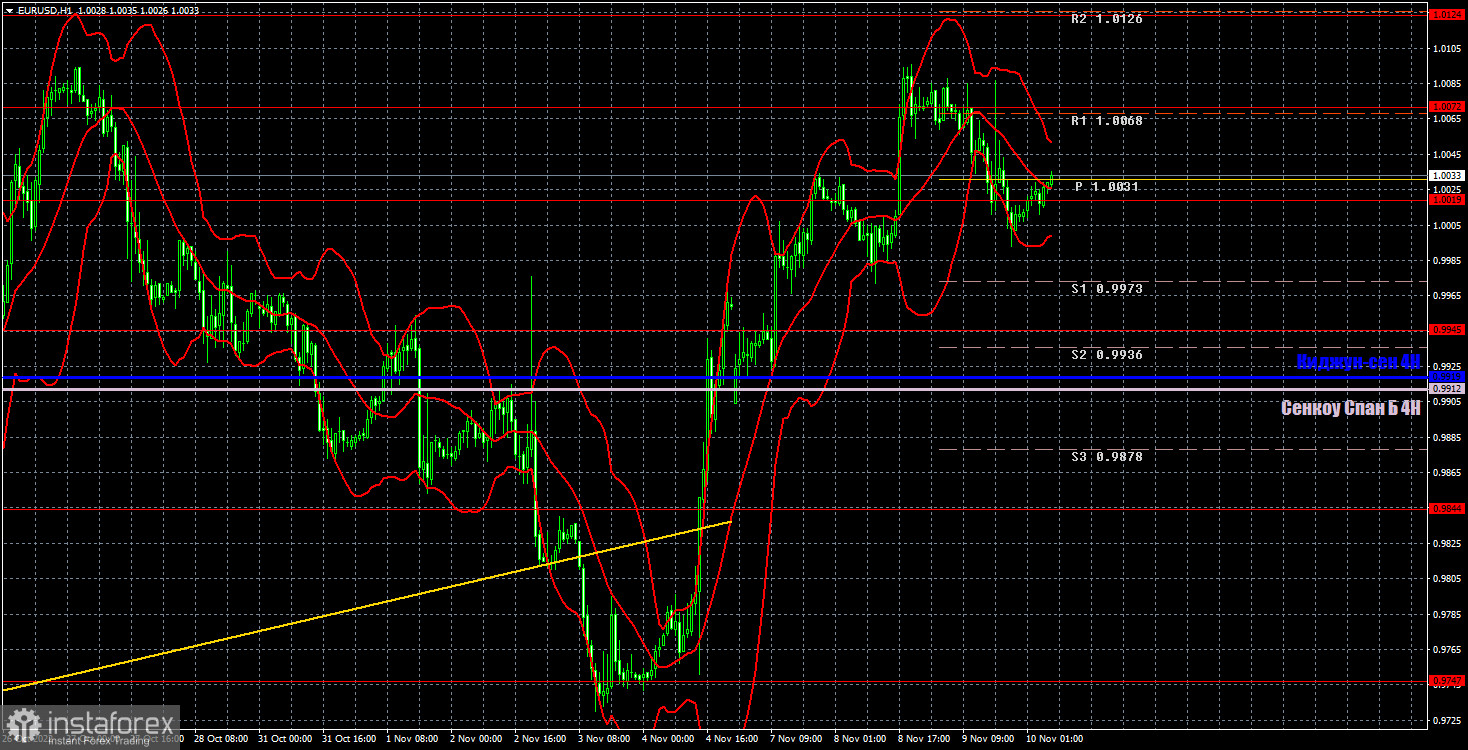
You can see that the pair continues to rise on the one-hour chart, has overcome the Ichimoku cloud on the 24-hour timeframe, as well as all the Ichimoku lines on the 4-hour timeframe. However, it was not possible to surpass its last local high, and there is no trend line or channel. Everything looks as if we are facing a series of short-term trends and now the pair will fall by 200-300 points. On Thursday, the pair may trade at the following levels: 0.9844, 0.9945, 1.0019, 1.0072, 1.0124, 1.0195, 1.0269, as well as the Senkou Span B (0.9912) and Kijun-sen lines (0.9919). Lines of the Ichimoku indicator may move during the day, which should be taken into account when determining trading signals. There are also support and resistance levels, but signals are not formed near these levels. Bounces and breakouts of the extreme levels and lines could act as signals. Don't forget about stop-loss orders, if the price covers 15 pips in the right direction. This will prevent you from losses in case of a false signal. No important events are expected in the European Union today, but in America the main report of the week on inflation will be released. So today the pair can show a fairly strong trend movement.
What we see on the trading charts:
Price levels of support and resistance are thick red lines, near which the movement may end. They do not provide trading signals.
The Kijun-sen and Senkou Span B lines are the lines of the Ichimoku indicator, moved to the one-hour chart from the 4-hour one. They are strong lines.
Extreme levels are thin red lines from which the price bounced earlier. They provide trading signals.
Yellow lines are trend lines, trend channels, and any other technical patterns.
Indicator 1 on the COT charts reflects the net position size of each category of traders.
Indicator 2 on the COT charts reflects the net position size for the non-commercial group.
 English
 Русский
 Bahasa Indonesia
 Bahasa Malay
 ไทย
ไทย Español
 Deutsch
 Български
 Français
 Tiếng Việt
 中文
中文 বাংলা
বাংলা हिन्दी
 Čeština
 Українська
 Română

