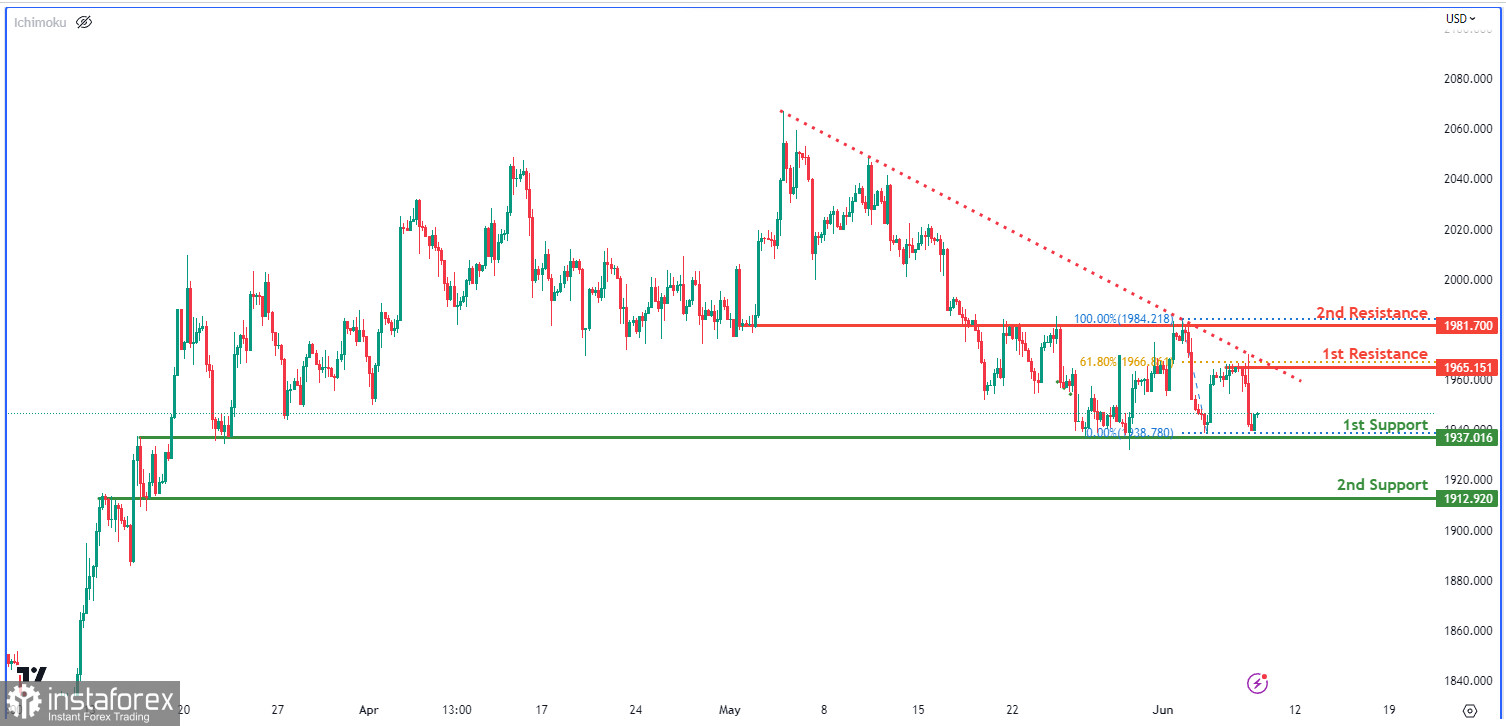
The XAU/USD chart is bearish with a downward trend. The price is below a descending trend line, indicating bearish momentum. There is a possibility of a temporary price increase before a reversal towards the first support level. The supports at 1937.01 and 1912.92 attracted buying interest. The first resistance at 1965.15 is significant, coinciding with the 61.80% Fibonacci retracement level. The second resistance at 1981.70 confirms its relevance.
 English
 Русский
 Bahasa Indonesia
 Bahasa Malay
 ไทย
ไทย Español
 Deutsch
 Български
 Français
 Tiếng Việt
 中文
中文 বাংলা
বাংলা हिन्दी
 Čeština
 Українська
 Română

