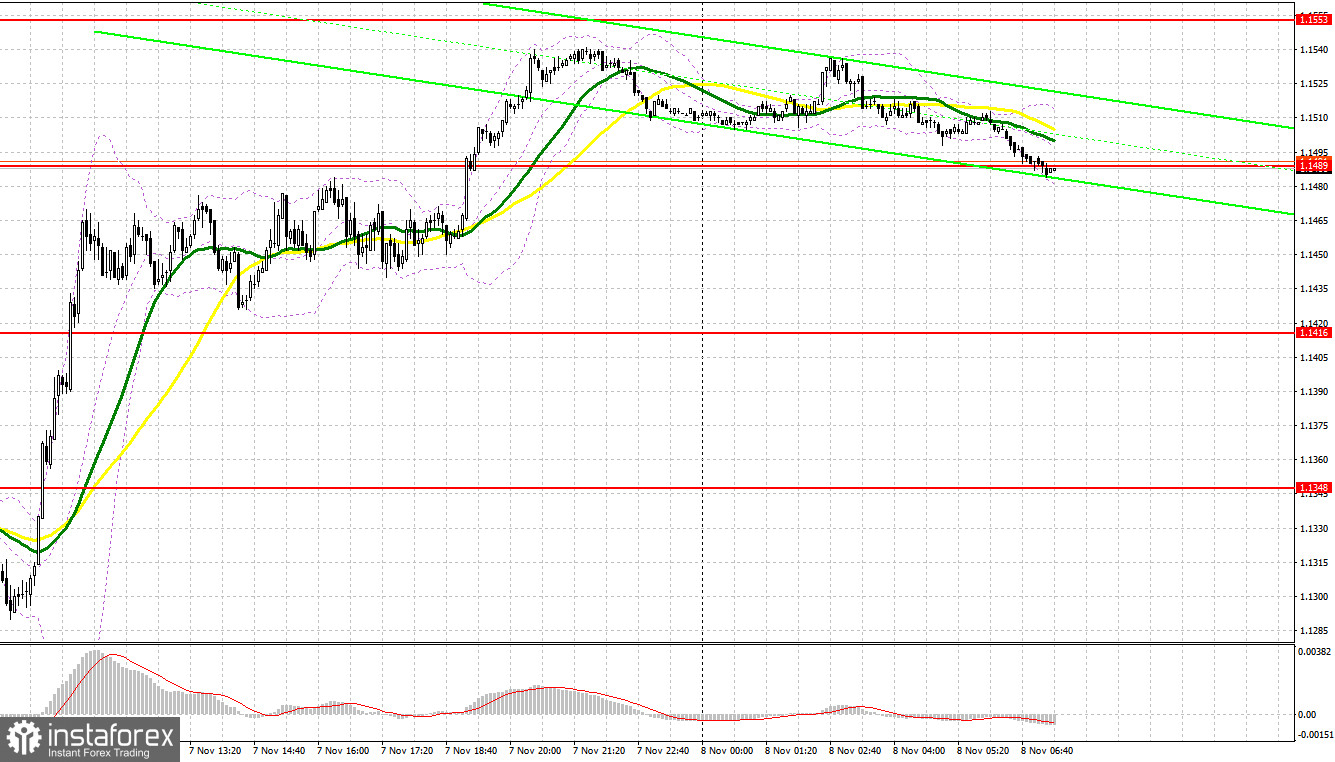
Yesterday, despite the strong upward movement of the pound, there were no signals to enter the market. Let's take a look at the 5-minute chart and see what happened. Earlier, I asked you to pay attention to the 1.1348 level to decide when to enter the market. A breakout of this range took place without a reverse test downwards, so it was not possible to enter long positions from there. A similar story happened in the 1.1416 level.

COT report:
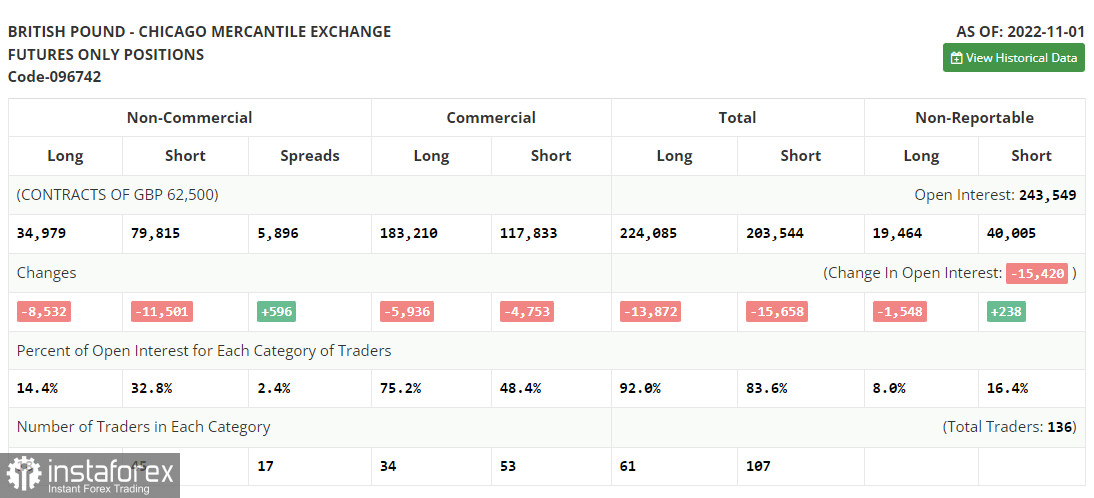
Before analyzing the technical picture of the pound, let's look at what happened in the futures market. The Commitment of Traders (COT) report for November 1 showed that both long and short positions decreased. Most likely, the upcoming meetings of the Federal Reserve and the Bank of England were to blame, after which the US dollar regained its appeal again, albeit only for a while. The current COT report does not yet take these decisions into account. The English central bank's decision to raise interest rates coincided with economists' forecasts, while BoE Governor Andrew Bailey said he was ready to slow down with further aggressive policies in favor of economic growth, which is declining rapidly. He also expressed concern about the crisis in the cost of living in the UK, which in the near future, due to a sharp increase in interest rates, may add to the crisis of the real estate market. Against this backdrop, the continued pace of interest rate hikes by the Fed and a more cautious position from the BoE led to a major sell-off of the pound. That all changed after data on the US labor market indicated a sharp contraction, becoming a serious reminder for the Fed at the end of the week that it needs to act more cautiously in the future. The latest COT report indicated that long non-commercial positions decreased by 8,532 to 34,979, while short non-commercial positions decreased by 11,501 to 79,815, resulting in a slight decline in the negative non-commercial net position to -44,836 against -47,805 a week earlier. The weekly closing price increased and amounted to 1.1499 against 1.1489.

When to go long on GBP/USD:
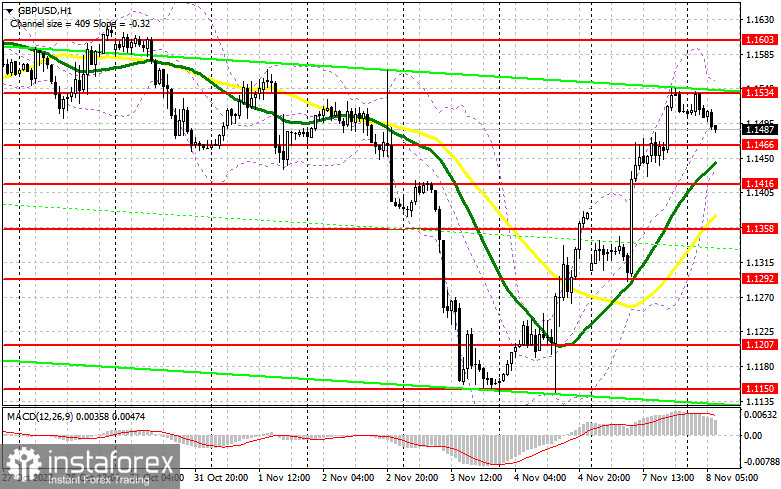
Today there are no statistics on the UK, which may keep the demand for the British pound in the short term. To maintain the upward potential, the bulls need to be active in the area of the nearest support at 1.1466, just below which there are moving averages, playing on their side. A false breakout at this level will lead to a buy signal with a re-exit at 1.1534, above which it was not possible to break through yesterday. Without this level, it will be difficult for the bulls to build a bullish market in the future. We can only talk about the continuation of the upward correction if the pair moves higher, and a breakout of 1.1534, together with a reverse downward test, will open the way to a high of 1.1603, where it will become more difficult for the bulls to control the market. The farthest target is located at 1.1666 and I recommend locking in profit there. However, we can only expect this kind of growth after the US inflation report is published, scheduled for the second half of this week.
If the bulls do not cope with the tasks set and miss 1.1466, the level at the end of yesterday, then the pair will be under pressure. If this happens, I recommend postponing long positions to 1.1416. It will be wise to go long after a false breakout. It is also possible to buy the asset just after a bounce off from 1.1358, or even lower - around 1.1292, expecting a rise of 30-35 pips.
When to go short on GBP/USD:
The bears are in no hurry to return to the market after Friday's reports, but in order not to completely lose the initiative, you need to be active around 1.1534, otherwise you can hold out until the last month's high is updated. In case the pound rises, a false breakout at 1.1534 is a signal to sell, counting on a downward correction and a fall to the nearest support at 1.1466. A breakthrough and reverse test upwards of this range will be a signal for shorts with the update of the low at 1.1416. The farthest target is located at 1.1358 and I recommend locking in profit there.
In case the pair grows and bears fail to protect 1.1534, the bulls will regain control of the situation, counting on building a new upward trend to the area of the weekly high at 1.1610. A false breakout at this level will provide an entry point into shorts with the goal of moving down. If bears are not active there, then we might see a surge up to the high of 1.1666. Therefore, I advise you to go short after a rebound, expecting a decline of 30-35 pips.

Indicator signals:
Trading is performed above the 30- and 50-day moving averages, which indicates further growth for the pound.
Moving averages
Note: The period and prices of moving averages are considered by the author on the one-hour chart, which differs from the general definition of the classic daily moving averages on the daily chart.
Bollinger Bands
A break of the upper limit of the indicator in the 1.1540 level will lead to a new wave of growth for the pound.
Description of indicators
- Moving average (moving average, determines the current trend by smoothing volatility and noise). The period is 50. It is marked in yellow on the chart.
- Moving average (moving average, determines the current trend by smoothing volatility and noise). The period is 30. It is marked in green on the graph.
- MACD indicator (Moving Average Convergence/Divergence - convergence/divergence of moving averages). A fast EMA period is 12. A slow EMA period is 26. The SMA period is 9.
- Bollinger Bands. The period is 20.
- Non-profit speculative traders are individual traders, hedge funds, and large institutions that use the futures market for speculative purposes and meet certain requirements.
- Long non-commercial positions are the total number of long positions opened by non-commercial traders.
- Short non-commercial positions are the total number of short positions opened by non-commercial traders.
- The total non-commercial net position is a difference in the number of short and long positions opened by non-commercial traders.
 English
 Русский
 Bahasa Indonesia
 Bahasa Malay
 ไทย
ไทย Español
 Deutsch
 Български
 Français
 Tiếng Việt
 中文
中文 বাংলা
বাংলা हिन्दी
 Čeština
 Українська
 Română

