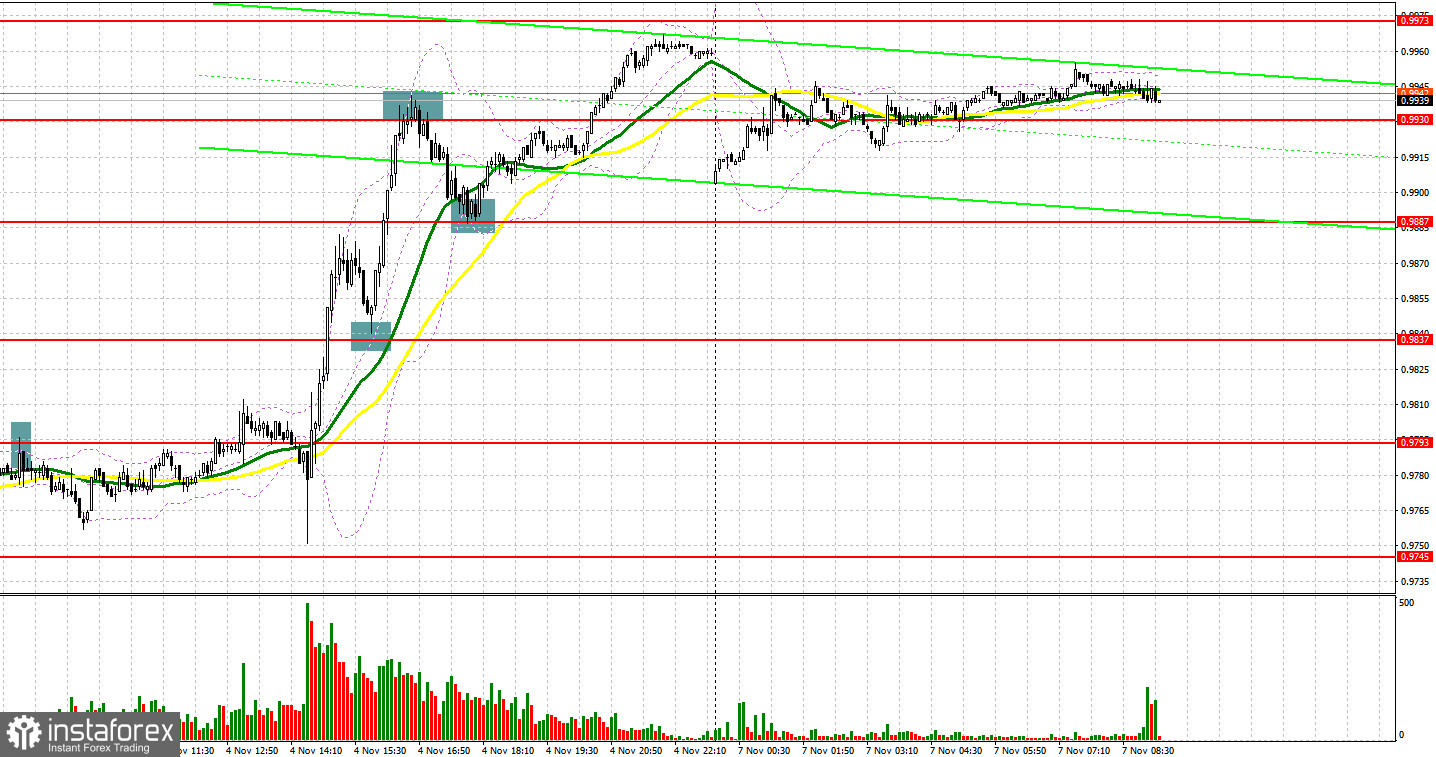
On Friday, EUR/USD created a few excellent signals for market entry. Let's take a look at the 5-minute chart and try to figure out what actually happened. In my morning review, I took notice of 0.9793 and recommended selling from this level. The price actually grew there. A false breakout at about 0.9739 assured traders to open short positions. Besides, macroeconomic data from the eurozone discourages traders. As a result, the currency pair sank more than 35 pips but the price missed the nearest support at 0.9745. In the second half of the day, EUR climbed above 0.9837 in light of the downbeat statistics on the US labor market. The opposite downward test of this level created an excellent buy signal which pushed the price 90 pips up. A false breakout at 0.9930 brought a sell signal during the correction to 0.9887 where traders again bought the pair at a false breakout. In consequence, the instrument jumped to 0.9973.

What is needed to open long positions on EUR/USD
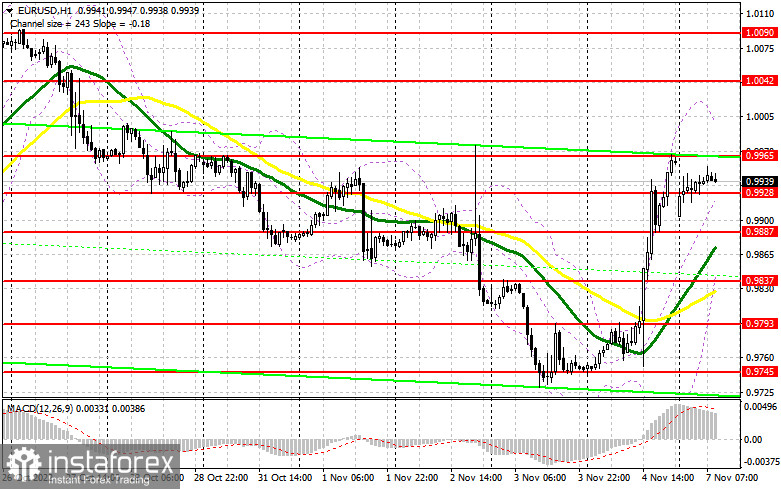
The unemployment rate in the US rose to 3.7% in October from 3.5% in September. This downbeat figure was bearish for the US dollar which, in turn, reinforced the euro. Today, EUR/USD is likely to continue its efforts to grow, though the economic calendar lacks fundamental data to encourage EUR's growth. Remarks by ECB President Christine Lagarde and Member of the Executive Board Fabio Panetta could inspire the bulls to break one-week highs. The euro could find support from a strong Sentix investor confidence index for the EU, though it will hardly happen. In case EUR/USD declines, the level of 0.9929 will serve as the nearest support, but I wouldn't rely on it.
Only a false breakout there would enable a good market entry point for buy positions following the new uptrend aimed at a breakout of 0.9965. The downward test of this level will open the door to a more significant level of 1.0040 where the sellers should enter the market if they have enough strength. A breakout of this important level will deal a blow to the bears' stop orders and form an extra buy signal with the prospect of a jump towards 1.0090. This will reinforce the bullish trend. In case EUR/USD and the buyers are sluggish at 0.9928, the euro will come under downward pressure which will push the price to larger support at 0.9887. The reasonable solution will be buying EUR during a false breakout at about 0.9887. I would recommend buying EUR/USD immediately on a dip at 0.9837 or lower at 0.9793, bearing in mind an upward intraday correction of 3035 pips.
What is needed to open short positions on EUR/USD
The bears gave up following the weak US nonfarm payrolls. In essence, the market rebounded to its original condition after a huge sell-off triggered during the FED policy meeting. In the first half of the day, the sellers had to defend the nearest resistance at 0.9965. The reasonable scenario for opening short positions will be a false breakout after mixed statistics from the EU and a speech by Christine Lagarde. This will suggest an excellent entry point and will enable the price to pull back to 0.9928 which is the intermediate support formed during the Asian trade. If the price settles below this area as well as the opposite test upward will be an excuse to sell EUR/USD aiming to ruin the bulls' stop orders. Then, the price could fall at to a larger extent to 0.9887 where the sellers might encounter problems again. The most distant sell target is seen at 0.9837 which coincides with moving averages playing in the bulls' favor. This is where I recommend profit-taking. In case EUR/USD moves up in the European session and the bears are sluggish at 0.9965, demand for EUR will increase which will pave the way to a larger correction toward 1.0040. In this case, we should not hurry to open short positions. I would recommend opening short positions only on the condition of a false breakout. We could sell EUR/USD immediately at a bounce from the high of 1.0090 or higher from 1.0135, bearing in mind a downward intraday correction of 30-35 pips.

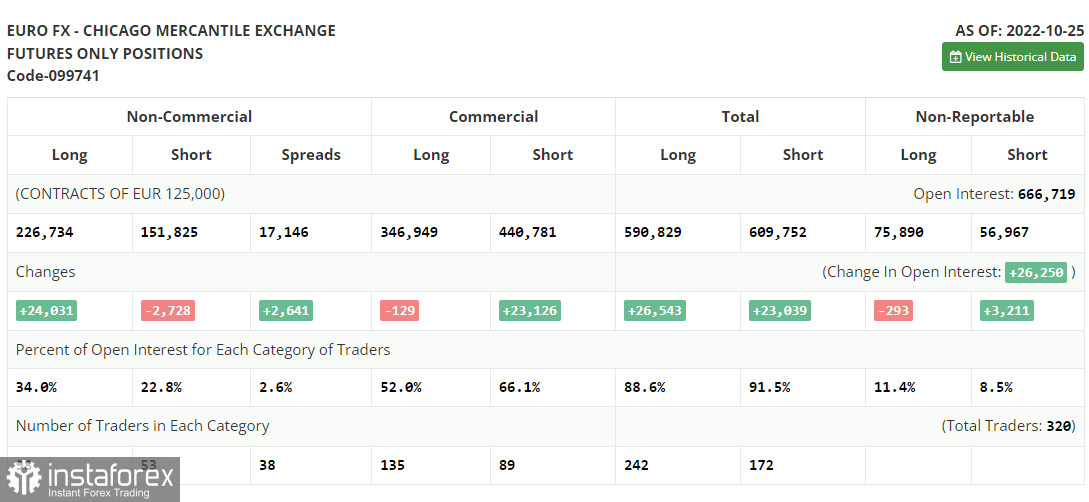
According to the COT (Commitment of Traders) report from October 25, we notice contraction in short positions and growth in long ones. Apparently, the US dollar is losing favor with investors because there are more signs that the US economy is slipping into a recession due to the Fed's extremely aggressive monetary tightening. Last week, the US central bank again resorted to a sharp rate hike. The Fed is committed to bringing inflation down steadily at a cost of an economic slowdown. At the same time, the euro's bullish potential is capped by the ECB's recent policy update. The rate hike was accompanied by the ECB statement that the aggressive monetary policy could be revised in the near future if the EU economy keeps on shrinking at a fast pace.
The last COT report reads that long non-commercial positions dropped rose by 24,031 to 226,734 whereas short non-commercial positions dropped by 2,728 to 151,852. The overall net non-commercial positions remained positive last week standing at 74,909 against 48,150 a week ago. It means that investors are taking advantage, buying the euro at lows below the parity level. They also accumulate long positions reckoning that the crisis will eventually come to an end and EUR/USD will recover in the long term. The currency pair closed last week at 1.000, higher than 0.9895 in the previous week.

Indicators' signals:
The currency pair is trading above the 30 and 50 daily moving averages. It indicates further growth of EUR/USD.
Moving averages
Note: The period and prices of moving averages are considered by the author on the H1 hourly chart and differ from the general definition of the classic daily moving averages on the daily D1 chart.
Bollinger Bands
If EUR/USD goes up, the indicator's upper border at 0.9995 will serve as resistance. Otherwise, if the currency pair declines, the lower border at nearly 0.0937 will act as support.
Description of indicators
- Moving average (moving average, determines the current trend by smoothing out volatility and noise). Period 50. It is marked yellow on the chart.
- Moving average (moving average, determines the current trend by smoothing out volatility and noise). Period 30. It is marked green on the chart.
- MACD indicator (Moving Average Convergence/Divergence — convergence/divergence of moving averages) Quick EMA period 12. Slow EMA period to 26. SMA period 9
- Bollinger Bands (Bollinger Bands). Period 20
- Non-commercial speculative traders, such as individual traders, hedge funds, and large institutions that use the futures market for speculative purposes and meet certain requirements.
- Long non-commercial positions represent the total long open position of non-commercial traders.
- Short non-commercial positions represent the total short open position of non-commercial traders.
- Total non-commercial net position is the difference between short and long positions of non-commercial traders.
 English
 Русский
 Bahasa Indonesia
 Bahasa Malay
 ไทย
ไทย Español
 Deutsch
 Български
 Français
 Tiếng Việt
 中文
中文 বাংলা
বাংলা हिन्दी
 Čeština
 Українська
 Română

