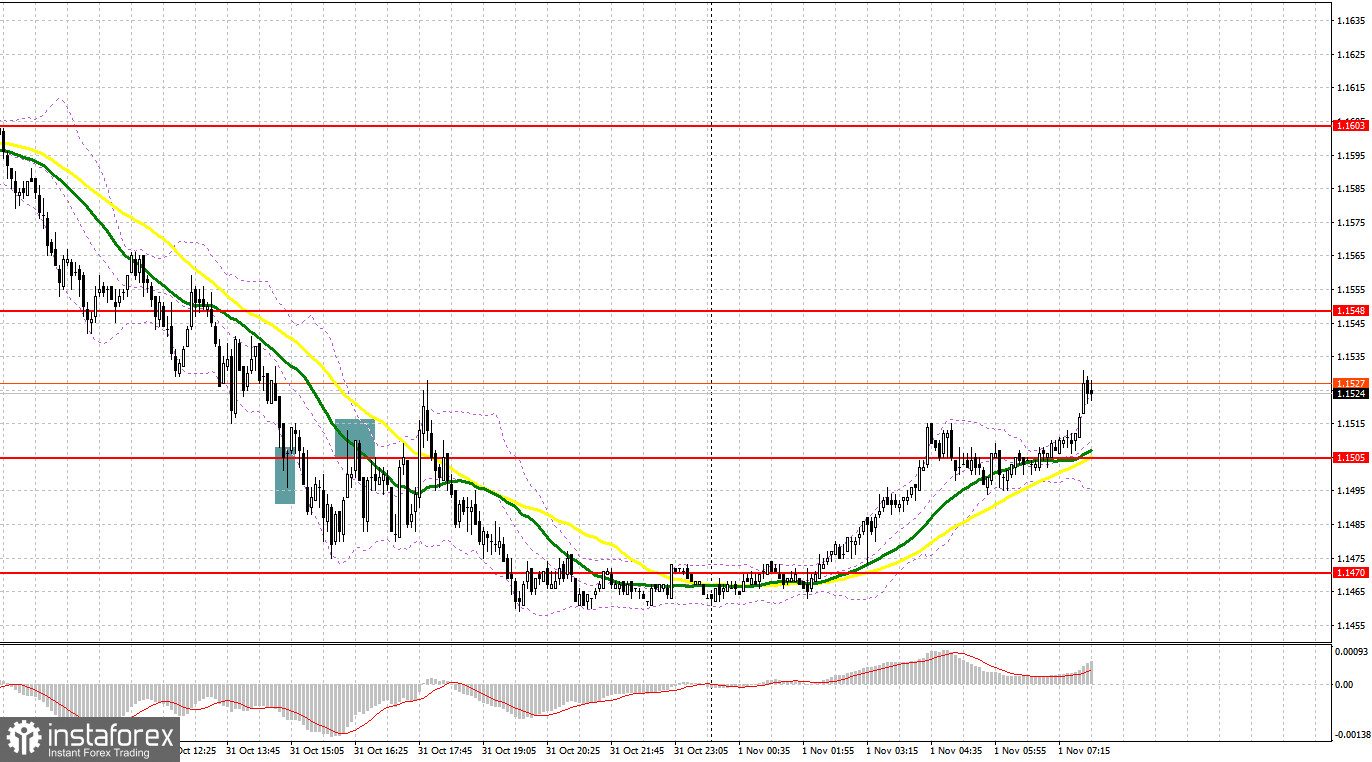
Yesterday was not the most profitable day for trading. Let's take a look at the 5-minute chart and see what happened. Earlier, I asked you to pay attention to the 1.1560 level to decide when to enter the market. As a result of falling to this level, nothing interesting was formed. The level was "smeared out" and it was not possible to see confirming signals there. In the afternoon, a false breakout at 1.1505 led to a buy signal, but the growth did not take place, and so traders suffered losses. After an update at 1.1505, a sell signal was formed, but the downward movement amounted to about 20 points, and that was it.

When to go long on GBP/USD:
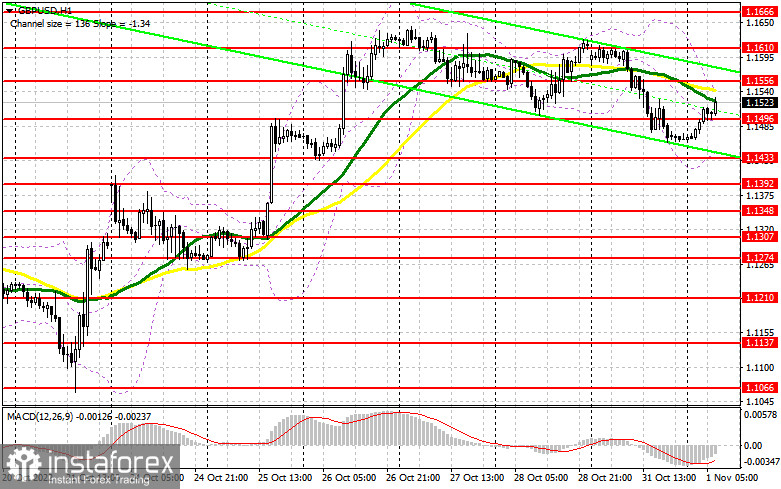
Yesterday's data on lending in the UK was quite good, but it did not help the pound. Despite this, we can see how the pair is actively redeemed each time after a fairly significant correction, which shows the presence of big players and their interest in the market. Today, traders will expect strong statistics, especially on PMI. Reports are expected on the Nationwide House Price Index and the UK Manufacturing PMI. If manufacturing declines less than forecast, the pound will have a good chance of rebounding above 1.1556. If the data turns out to be disappointing, another downward movement of the pair is not ruled out. A false breakout in the area of the nearest support at 1.1496 will give a buy signal in order to restore and update the resistance of 1.1556, just below which the moving averages go, playing on the bears' side. A breakthrough and a test of this range may change the situation dramatically, allowing bulls to build a more powerful upward trend with the prospect of updating 1.1610 and further exit to 1.1666. The farthest target of the bulls will be 1.1722, where I recommend taking profits.
If the bulls do not cope with the tasks set and miss 1.1496, then the pair will be under pressure. In this case, it will be wise to go long after a false breakout of 1.1433. It is also possible to buy the asset just after a bounce off from 1.1392, or even lower - around 1.1348, expecting a rise of 30-35 pips.
When to go short on GBP/USD:
Bears will try to keep the pair in a downward correctional channel. It will remain so until the moment when the pair is below 1.1556. Therefore, it is important that a false breakout is formed at this level in case the pound grows further after we receive the data. A good sell signal from 1.1556 could push the pound back towards 1.1496, the support formed in the Asian session. A lot depends on this level, so I expect a good fight there. A breakthrough and an upwardly test of this level will provide an entry point in anticipation of updating this week's low and reaching the next support at 1.1433. The farthest target will be the area of 1.1392, where I recommend taking profits.
In case the pair grows and bears fail to protect 1.1556, the bulls will continue to enter the market, counting on building a new upward trend. This will push the pair to the 1.1610 area. Only a false breakout at this level will provide an entry point into shorts with the goal of moving down. If traders are not active there, I advise you to go short after a rebound from 1.1666, expecting a decline of 30-35 pips.

Signals of indicators:
Trading is performed below the 30- and 50-day moving averages, which indicates problems for bulls on the pound.
Moving averages
Note: The period and prices of moving averages are considered by the author on the one-hour chart, which differs from the general definition of the classic daily moving averages on the daily chart.
Bollinger Bands
If the pair drops, the lower limit of the indicator around 1.1433 will act as support.
Description of indicators
- Moving average (moving average, determines the current trend by smoothing volatility and noise). The period is 50. It is marked in yellow on the chart.
- Moving average (moving average, determines the current trend by smoothing volatility and noise). The period is 30. It is marked in green on the graph.
- MACD indicator (Moving Average Convergence/Divergence - convergence/divergence of moving averages). A fast EMA period is 12. A slow EMA period is 26. The SMA period is 9.
- Bollinger Bands. The period is 20.
- Non-profit speculative traders are individual traders, hedge funds, and large institutions that use the futures market for speculative purposes and meet certain requirements.
- Long non-commercial positions are the total number of long positions opened by non-commercial traders.
- Short non-commercial positions are the total number of short positions opened by non-commercial traders.
- The total non-commercial net position is a difference in the number of short and long positions opened by non-commercial traders.
 English
 Русский
 Bahasa Indonesia
 Bahasa Malay
 ไทย
ไทย Español
 Deutsch
 Български
 Français
 Tiếng Việt
 中文
中文 বাংলা
বাংলা हिन्दी
 Čeština
 Українська
 Română

