#Bitcoin
Analysis:
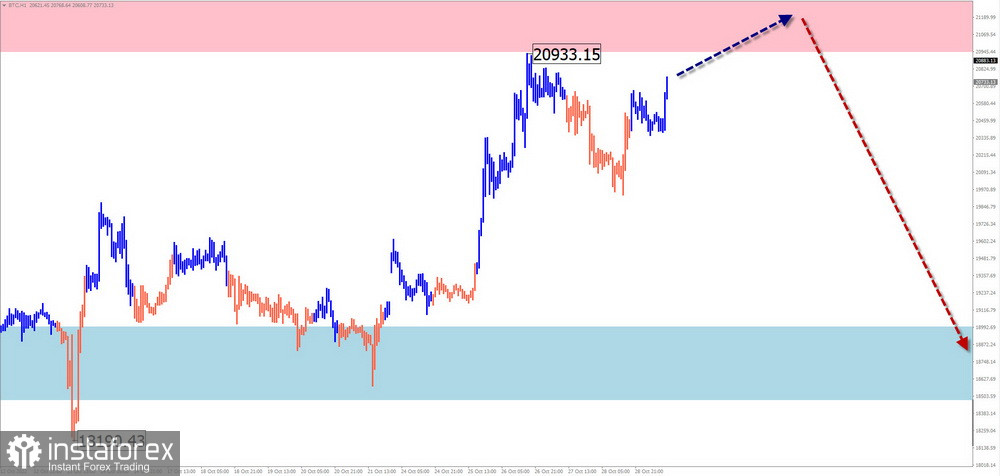
Wave analysis of the unfinished section of the main bearish trend from the end of July shows that bitcoin quotes have formed a flat correction in the last two months. Most of all, on the chart, it resembles the figure "Pennant." The structure of this movement is close to completion. Nevertheless, there are no signals of an imminent reversal on the chart.
Forecast:
In the next couple of days, the upward movement vector of bitcoin is expected to continue, with the price rising to the resistance zone. With a high probability, further, on this chart section, the price will drift, forming a reversal pattern. By the end of the week, you can expect the activation and the course of the altcoin rate to go down.

Potential reversal zones
Resistance:
- 20950.0/21150.0
Support:
- 19000.0/18800.0
Recommendations:
Purchases: risky and can lead to losses.
Sales: will become relevant after the corresponding signals of your trading systems appear in the area of the resistance zone.
#Ethereum
Analysis:
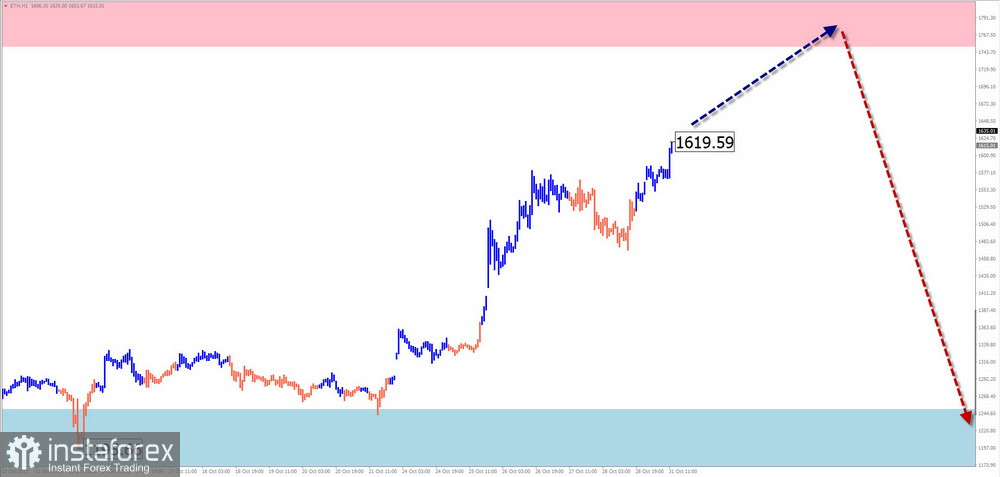
Since November last year, the Ethereum market has been dominated by a bearish mood. The last unfinished wave structure has been counting down since mid-June. This plane is similar in shape to a "flag" or "pennant." The overall structure took the place of correction (B) of the previous trend area. The price is squeezed in a narrow price corridor between two opposing zones.
Forecast:
At the beginning of the coming week, the completion of the upward movement vector is expected. In the area of the calculated resistance, you can wait for a stop and the formation of conditions for a reversal. By the end of the week, we can expect an increase in volatility and the resumption of the course of the ether price down.

Potential reversal zones
Resistance:
- 1750.0/1850.0
Support:
- 1250.0/1150.0
Recommendations:
Purchases: are quite risky and can lead to deposit losses.
Sales: this will become possible with a reduced lot after the appearance of reversal signals of your vehicles in the area of the resistance zone.
EUR/GBP
Analysis:
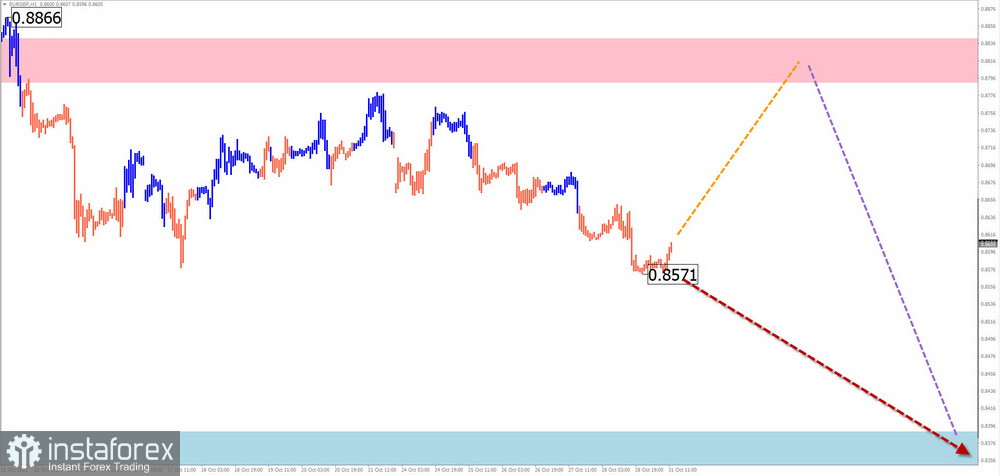
Analysis of the weekly chart of the euro/pound cross pair shows the formation of a descending horizontal plane. The section of traffic from September 26 gave the beginning of the final part (C). The price has been drifting horizontally for the current month, forming an intermediate pullback. After its completion, the further decline will continue.
Forecast:
The flat mood of the movement is likely in the coming days of the upcoming week. A short-term rise to the resistance area is not excluded. Further from this zone, you can expect a reversal and a resumption of the downward direction.

Potential reversal zones
Resistance:
- 0.8790/0.8840
Support:
- 0.8390/0.8340
Recommendations:
Purchases: carry a high share of risk and are not recommended.
Sales: After the corresponding signals of your trading systems appear in the area of the resistance zone, they can become the main directions for transactions.
AUD/JPY
Analysis:
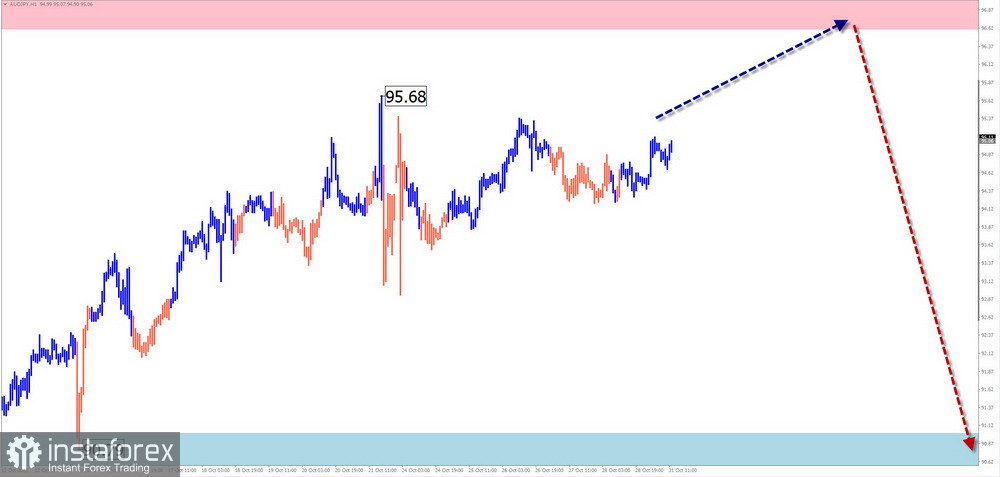
The Australian dollar cross-pair market against the Japanese yen has been moving quotes to the "north" of the price field for more than two years. Since the end of March, the price has been forming a horizontal correction along the powerful resistance zone. On the graph, it looks like a shifting plane. The structure of this section is not complete. Quotes are squeezed between the nearest zones of the opposite direction.
Forecast:
There is a high probability of an upward movement vector in the coming days. In the area of the resistance zone, the end of the rise and the formation of a reversal is expected. By the end of the week, the probability of a decline in the pair's exchange rate increases. The support border shows the most expected lower zone of the weekly range.

Potential reversal zones
Resistance:
- 96.60/97.10
Support:
- 91.00/90.50
Recommendations:
Purchases: possible with a reduced lot within the intraday.
Sales: will become relevant after the appearance of reversal signals in the area of the resistance zone.
Explanations: In simplified wave analysis (UVA), all waves consist of 3 parts (A-B-C). At each TF, the last incomplete wave is analyzed. The dotted line shows the expected movements.
Attention: the wave algorithm does not consider the duration of the movements of the instruments in time!
 English
 Русский
 Bahasa Indonesia
 Bahasa Malay
 ไทย
ไทย Español
 Deutsch
 Български
 Français
 Tiếng Việt
 中文
中文 বাংলা
বাংলা हिन्दी
 Čeština
 Українська
 Română

