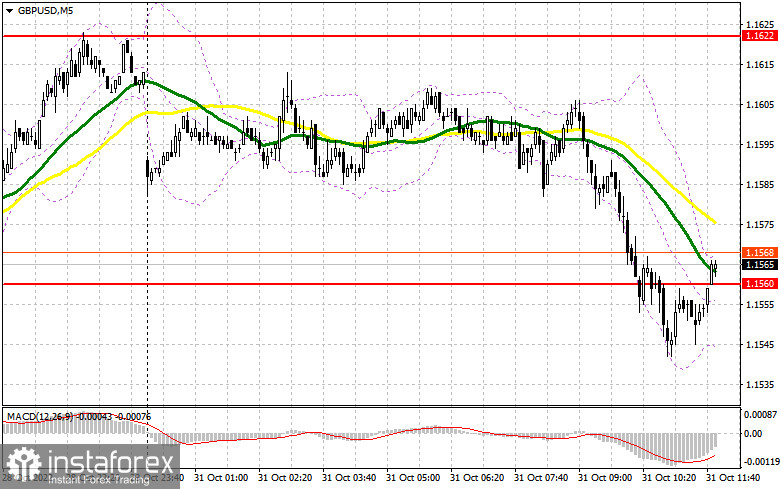
In the morning article, I turned your attention to 1.1560 and recommended making decisions with this level in focus. Now, let's look at the 5-minute chart and figure out what actually happened. After a fall to this level, there were no signals. The pair was fluctuating near 1.1560. It was hard to discern any signals. In the afternoon, the technical outlook was revised.

When to open long positions on GBP/USD:
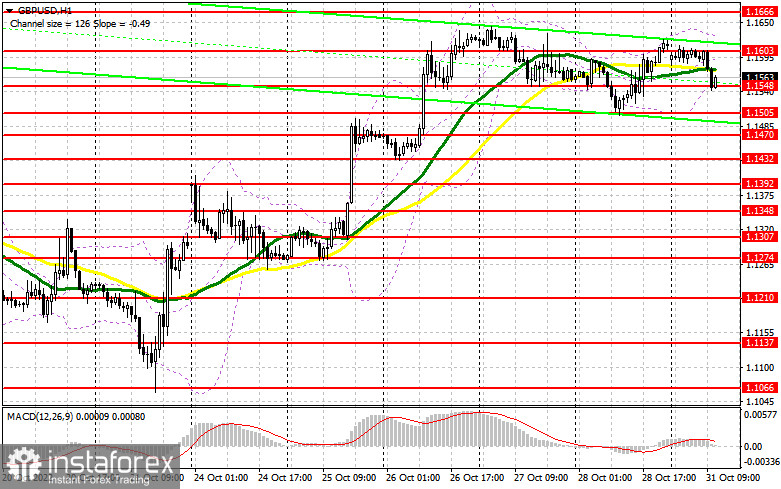
In the afternoon, there will be no economic reports that could greatly impact the market sentiment. therefore, the pair is likely to keep trading in the sideways channel with the bears remaining in control at the end of this month. In the case of a decline in GBP/USD, only another false breakout of the support level of 1.1548, formed at the end of the first half of the day, will give a buy signal. The pair may return to the resistance level of 1.1603. If the bulls fail to push the pair to this level, the pair will hardly resume an upward movement and reach monthly highs. To cement the uptrend, the pair should consolidate above this level. A breakout of 1.1603 and a downward test of this level will open the path to a high of 1.1666 and a resistance level of 1.1722. If this scenario comes true, it will be rather hard for buyers to control the market. A more distant target will be the 1.1757 level. If the pair approaches this level, sellers may lose the upper hand. I recommend locking in profits there. If GBP/USD drops and bulls show no activity at 1.1548, it could reach 1.1505, the lower border of the sideways channel. It is better to open long positions at this level only after a false breakout occurs. You can buy GBP/USD immediately at a bounce from 1.1470 or 1.1432, keeping in mind the upward intraday correction of 30-35 pips.
When to open short positions on GBP/USD:
Bears are trying to regain control of the market. However, it is quite hard now. It appears the risk-on sentiment is declining at the end of this month. Importantly, it has not fundamentally affected the market sentiment yet. The US will release today a batch of economic reports, including the Chicago PMI Index. Traders are sure to pay zero attention to them. Therefore, sellers need to defend the resistance level of 1.1603 formed in the first half of the day. If GBP/USD grows amid weak US macro stats, only a false breakout there will offer a selling opportunity. The pressure on the pair could increase. So, there might be a correction to the nearest support level of 1.1548. A breakout and an upward test will give a sell signal already with the prospect of a decrease to a low of 1.1505. A more distant target will be the 1.1470 level where I recommend locking in profits. If GBP/USD rises and bears show no energy at 1.1603 in the afternoon, bears will hardly be able to tip the balance of power. In this case, an upward correction to a high of 1.1666 may occur. Only a false breakout of this level will give a sell signal with the prospect of the resumption of the downward movement. If bears do not try to protect this level, the pair could grow to 1.1722. You can sell GBP/USD at this level immediately after a bounce, keeping in mind the downward intraday correction of 30-35 pips.

COT report
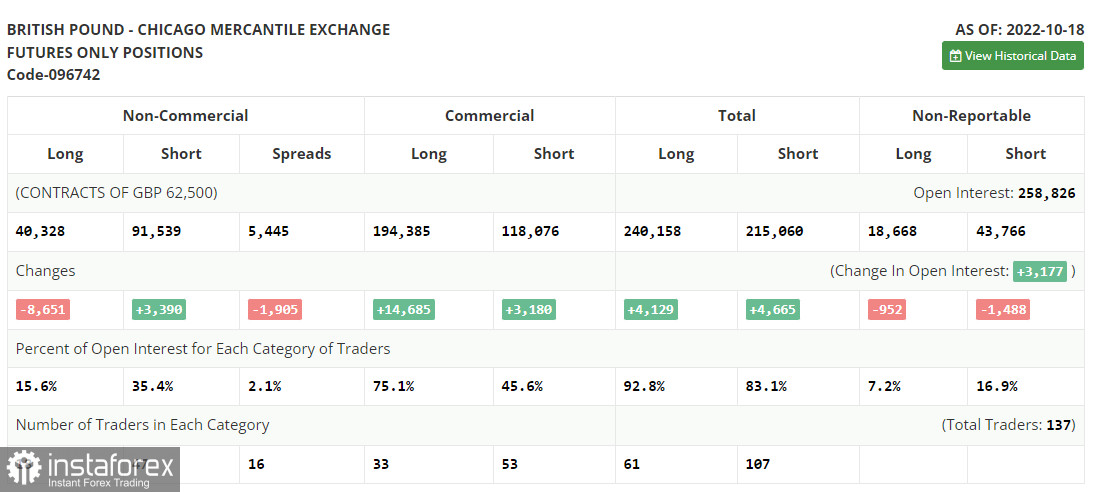
The COT report (Commitment of Traders) for October 18 logged a sharp drop in long positions and an increase in short ones. The resignation of British Prime Minister Liz Truss and the appointment of Rishi Sunak have had a positive impact on the pound sterling. However, investors remain concerned about the prospects of the UK economy due to soaring inflation. They believe that it will hardly be able to recover because of the headwinds such as the cost of living crisis, the worsening energy crisis, and high interest rates. Apart from that, retail sales, the main engine of economic growth, dropped sharply. It once again confirms the fact that households are not ready to spend extra money due to high prices. The pressure on the pound sterling will persist until the UK authorities find a way to solve economic issues. The latest COT report revealed that the number of long non-commercial positions decreased by 8,651 to 40,328, while the number of short non-commercial positions climbed by 3,390 to 91,539, which led to a slight increase in the negative delta of the non-commercial net position to -51,211 versus -39,170. The weekly closing price rose to 1.1332 against 1.1036.

Indicators' signals:
Trading is carried out near the 30 and 50 daily moving averages, which signals market uncertainty.
Moving averages
Note: The period and prices of moving averages are considered by the author on the H1 (1-hour) chart and differ from the general definition of the classic daily moving averages on the daily D1 chart.
Bollinger Bands
If GBP/USD moves up, the indicator's upper border at 1.1625 will serve as resistance.
Description of indicators
- Moving average (moving average, determines the current trend by smoothing out volatility and noise). Period 50. It is marked yellow on the chart.
- Moving average (moving average, determines the current trend by smoothing out volatility and noise). Period 30. It is marked green on the chart.
- MACD indicator (Moving Average Convergence/Divergence — convergence/divergence of moving averages) Quick EMA period 12. Slow EMA period to 26. SMA period 9
- Bollinger Bands (Bollinger Bands). Period 20
- Non-commercial speculative traders, such as individual traders, hedge funds, and large institutions that use the futures market for speculative purposes and meet certain requirements.
- Long non-commercial positions represent the total long open position of non-commercial traders.
- Short non-commercial positions represent the total short open position of non-commercial traders.
- Total non-commercial net position is the difference between the short and long positions of non-commercial traders.
 English
 Русский
 Bahasa Indonesia
 Bahasa Malay
 ไทย
ไทย Español
 Deutsch
 Български
 Français
 Tiếng Việt
 中文
中文 বাংলা
বাংলা हिन्दी
 Čeština
 Українська
 Română

