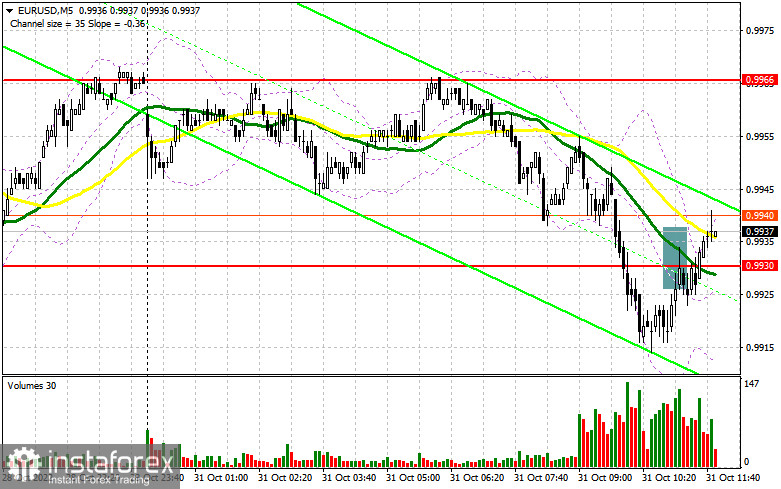
In my morning forecast, I paid attention to the 0.9930 level and recommended deciding on entering the market there. Let's look at the 5-minute chart and figure out what happened. Everything happened by analogy with last Friday, so nothing good could be obtained from the received signal. The decline and the breakdown of 0.9930 with the reverse test from the bottom up – all led to the entry point for the sale of the euro, but the pair went further down, which led to the fixation of losses. The technical picture changed in the afternoon, as has the strategy itself.

To open long positions on EURUSD, you need the following:
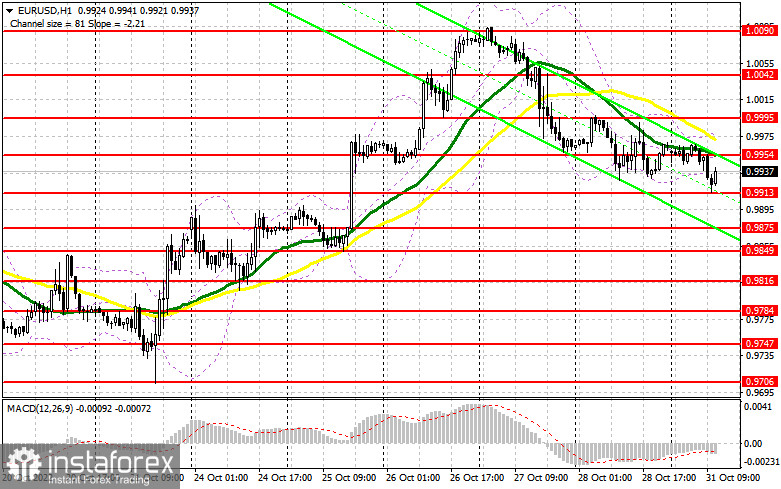
There are no important statistics for the American session. Thus, buyers will have every chance of a correction. Since we are following the scenario of last Friday today, I advise you to act accordingly. A sharp decline in the Chicago PMI index is unlikely to have a strong impact on the US dollar, so buyers should act after a decline in EUR/USD and the formation of a false breakdown in the area of the nearest support of 0.9913 formed by the results of the first half of the day. This will signal to opening of long positions based on the development of an upward trend and return to the resistance of 0.9954, where the moving averages that limit the upward potential of the pair pass. A breakthrough and a top-down update of this range against the background of weak US statistics will allow you to reach the maximum, in the area of 1.0000, giving additional hope for a larger upward movement to 1.0042. The farthest target will be the 1.0090 area, where I recommend fixing the profits. With the option of EUR/USD falling during the US session and the absence of buyers at 0.9913, the pressure on the pair will only increase as the bulls will continue to take profits at the end of this month. In this case, only a false breakdown in the area of the next support of 0.9875 will be a reason to buy the euro. I advise opening long positions on EUR/USD immediately for a rebound only from the support of 0.9849, or even lower – around the minimum of 0.9816 with the aim of an upward correction of 30-35 points within a day.
To open short positions on EURUSD, you need the following:
Sellers are still in control of the market. Trading below 0.9954 keeps the pressure on the pair, which may lead to a larger sell-off of the euro in the afternoon. A good option for opening short positions will be a false breakdown in this resistance area. It will indicate the presence of large players in the market counting on a fall in EUR/USD after the next increase in interest rates by the Federal Reserve, which we will know about in the middle of this week. An unsuccessful consolidation at 0.9954 will lead the euro's movement down to 0.9913. A breakdown and consolidation below this range, as well as a reverse test from the bottom up, form an additional sell signal with the demolition of buyers' stop orders and a decline in the euro to 0.9875, where I recommend fixing profits. We can expect to go beyond this level only after strong statistics on the United States. In the case of an upward movement of EUR/USD during the American session and the absence of bears at 0.9954, it will be possible to see a major upward jerk of the pair to the parity area. In this case, I advise you to postpone sales until 1.0000. The formation of a false breakout there will become a new starting point for entering short positions. You can sell EUR/USD immediately on a rebound from the maximum of 1.0042, or even higher – from 1.0090 with the aim of a downward correction of 30-35 points.


Signals of indicators:
Moving Averages
Trading is below the 30 and 50-day moving averages, which indicates a further fall in the euro.
Note. The author considers the period and prices of moving averages on the hourly chart H1 and differ from the general definition of the classic daily moving averages on the daily chart D1.
Bollinger Bands
In case of a decline, the lower limit of the indicator, around 0.9920, will act as support.
Description of indicators
- Moving average (moving average determines the current trend by smoothing out volatility and noise). Period 50. The graph is marked in yellow.
- Moving average (moving average determines the current trend by smoothing out volatility and noise). Period 30. The graph is marked in green.
- MACD indicator (Moving Average Convergence / Divergence - moving average convergence/divergence) Fast EMA period 12. Slow EMA period 26. SMA period 9
- Bollinger Bands (Bollinger Bands). Period 20
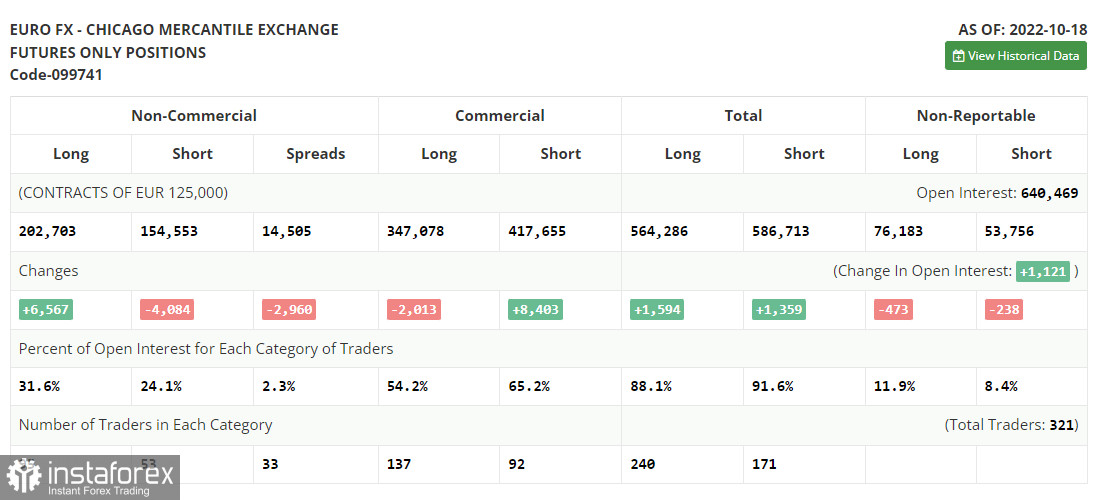
- Non-profit speculative traders, such as individual traders, hedge funds, and large institutions, use the futures market for speculative purposes and to meet certain requirements.
- Long non-commercial positions represent the total long open position of non-commercial traders.
- Short non-commercial positions represent the total short open position of non-commercial traders.
- Total non-commercial net position is the difference between the short and long positions of non-commercial traders.
 English
 Русский
 Bahasa Indonesia
 Bahasa Malay
 ไทย
ไทย Español
 Deutsch
 Български
 Français
 Tiếng Việt
 中文
中文 বাংলা
বাংলা हिन्दी
 Čeština
 Українська
 Română

