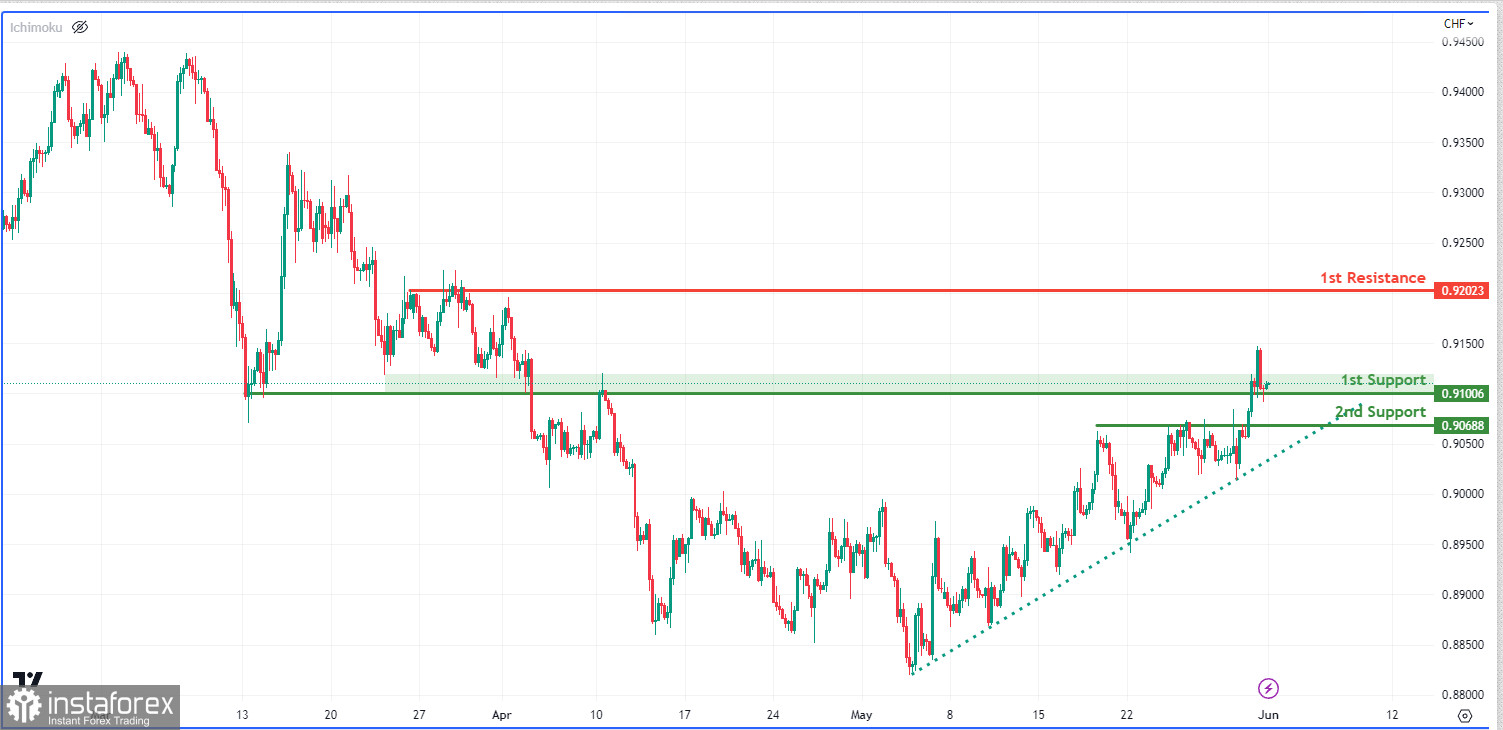
The USD/CHF chart displays a bullish momentum, indicating an upward trend. The price being above the bullish Ichimoku cloud and a major ascending trend line contributes to this positive sentiment.
Given the bullish momentum, there is a possibility of a bullish bounce from the first support level towards the first resistance level. The 0.9030 level serves as a significant support area, known as an overlap support, where buyers have previously entered the market. The second support at 0.9006 also adds to its significance as a pullback support.
However, the first resistance at 0.9062 may temporarily hinder upward movements, potentially causing a pause or retracement. This level is identified as a multi-swing high resistance and aligns with the 38.20% Fibonacci retracement, making it an important level to monitor.

 English
 Русский
 Bahasa Indonesia
 Bahasa Malay
 ไทย
ไทย Español
 Deutsch
 Български
 Français
 Tiếng Việt
 中文
中文 বাংলা
বাংলা हिन्दी
 Čeština
 Українська
 Română

