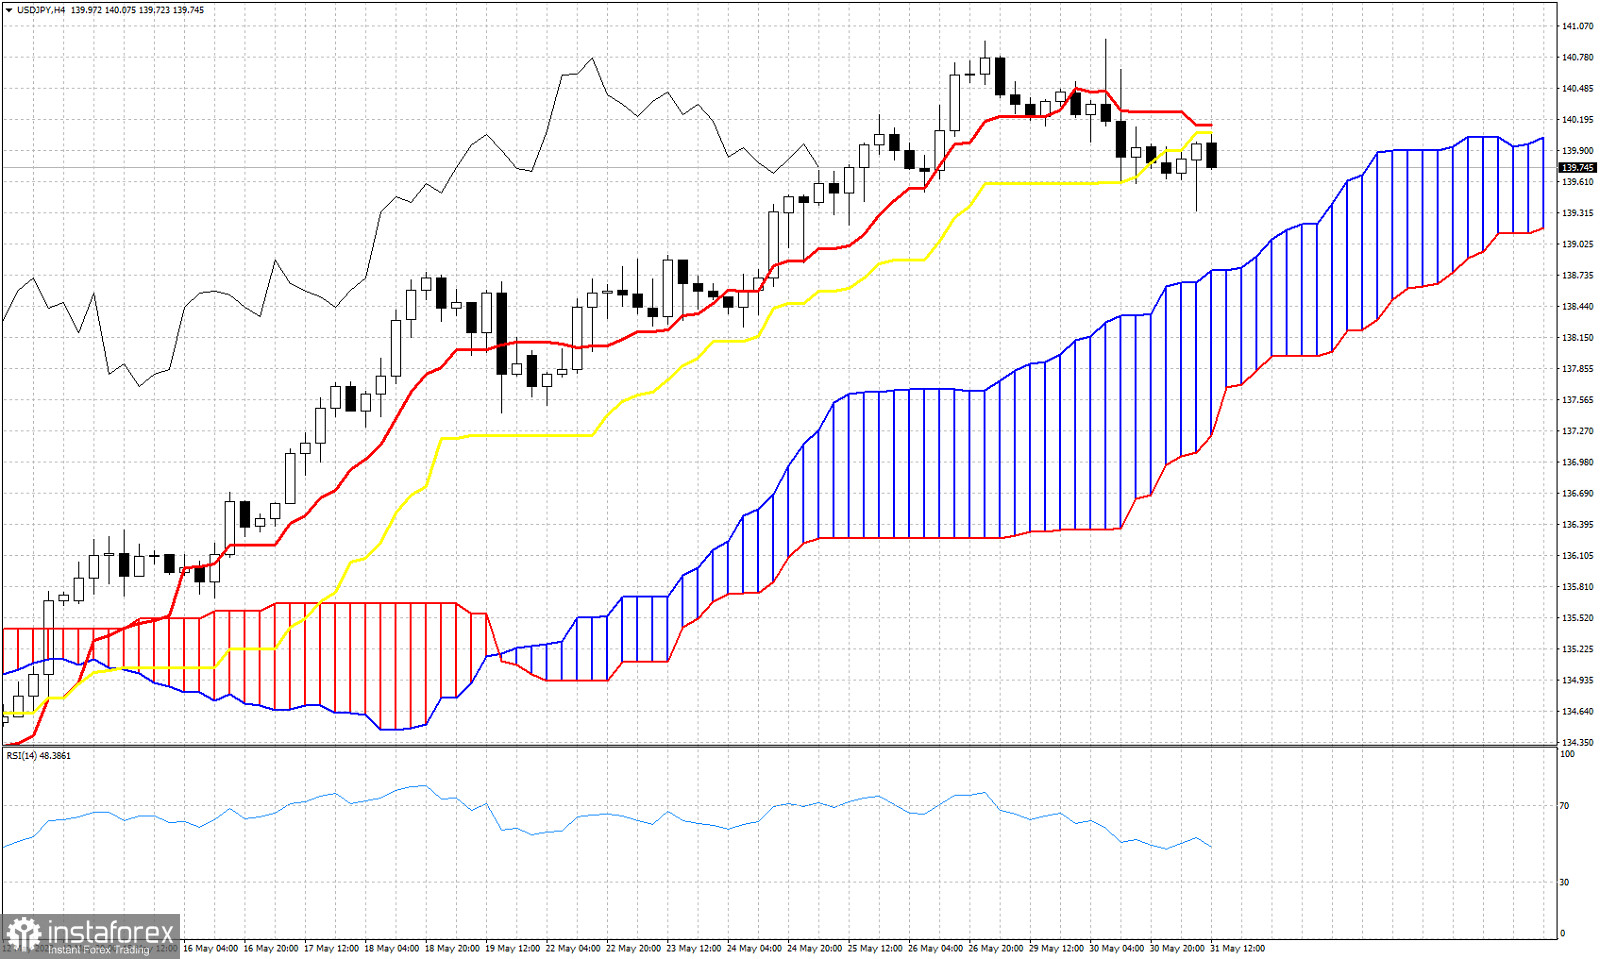
USDJPY remains in a bullish trend according to the Ichimoku cloud indicator since 135.67 that was the close on May 12th. Since then price remains above the Kumo (cloud) making higher highs and higher lows. Only recently price broke below the tenkan-sen (red line indicator) and the kijun-sen (yellow line indicator) providing the first sign of weakness. As long as price is below both these two indicators, price will remain vulnerable to a move towards the cloud support currently at 138.78. The Chikou span (black line indicator) is still above the candlestick pattern but is challenging support now at 139.60.
 English
 Русский
 Bahasa Indonesia
 Bahasa Malay
 ไทย
ไทย Español
 Deutsch
 Български
 Français
 Tiếng Việt
 中文
中文 বাংলা
বাংলা हिन्दी
 Čeština
 Українська
 Română

