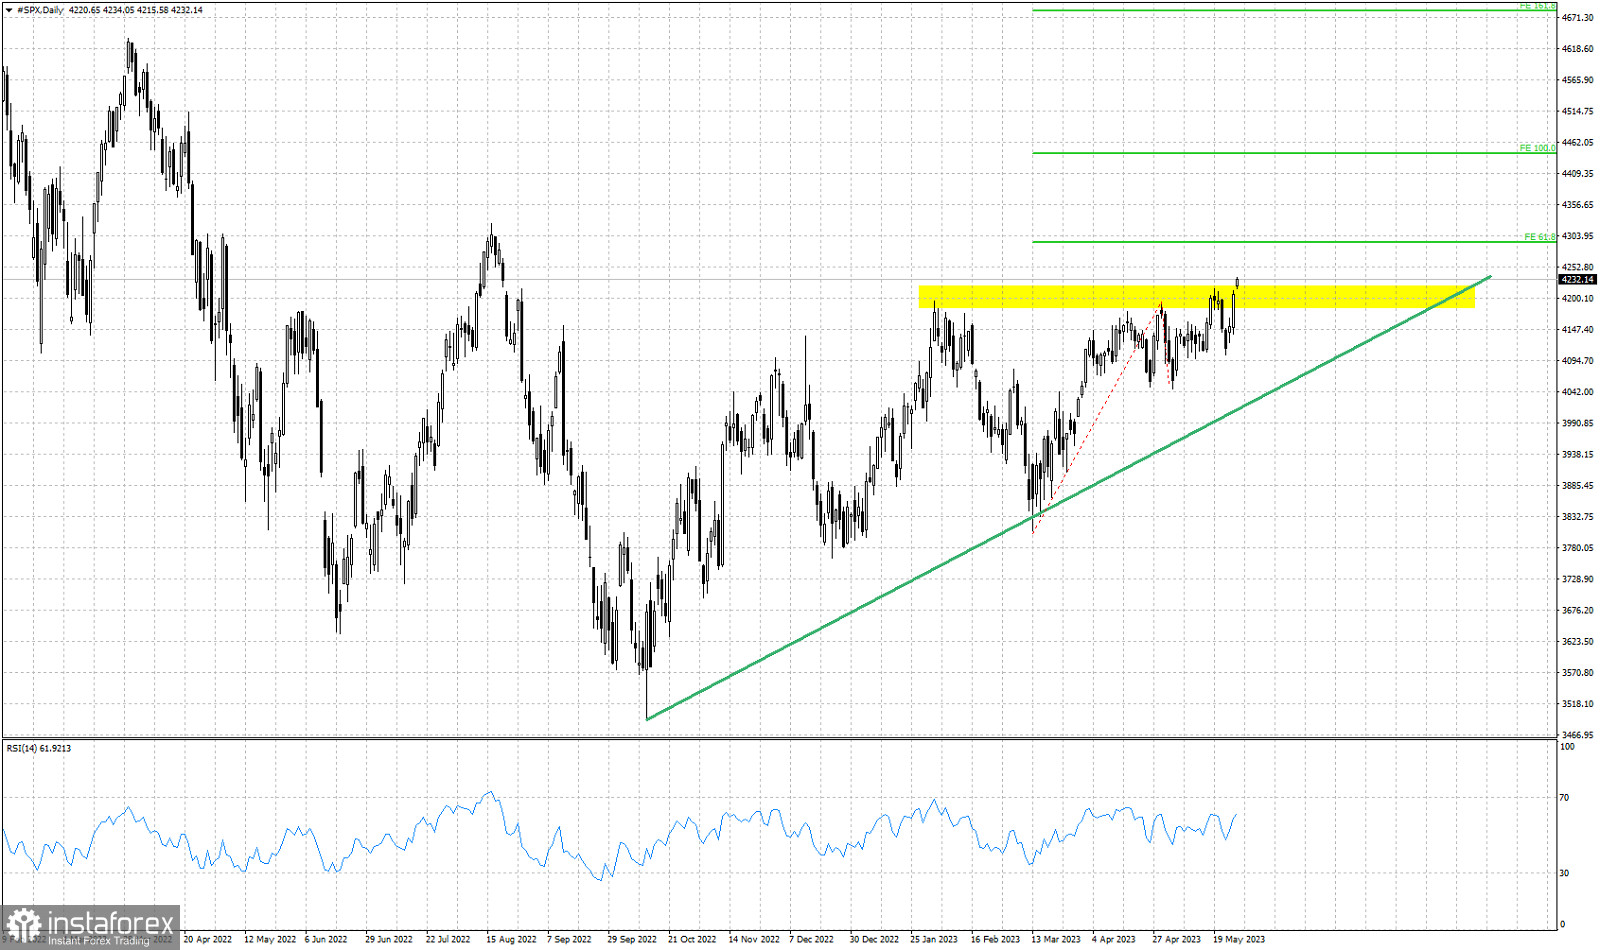
Green upward sloping line- support trend line
yellow rectangle- resistance area
Green horizontal lines- Fibonacci targets
SPX is exiting the resistance area shown by the yellow rectangle in the Daily chart. Price continues making higher highs and higher lows. The green support trend line has been respected so far and despite some weakness signs, support was never broken. SPX has upside potential to reach at 4,292 and even higher at 4,440. These two targets remain valid as long as price remains above 4,000 where we find the green trend line. If price breaks below 4,105, we should expect the green trend line to be challenged. Until then we remain bullish.
 English
 Русский
 Bahasa Indonesia
 Bahasa Malay
 ไทย
ไทย Español
 Deutsch
 Български
 Français
 Tiếng Việt
 中文
中文 বাংলা
বাংলা हिन्दी
 Čeština
 Українська
 Română

