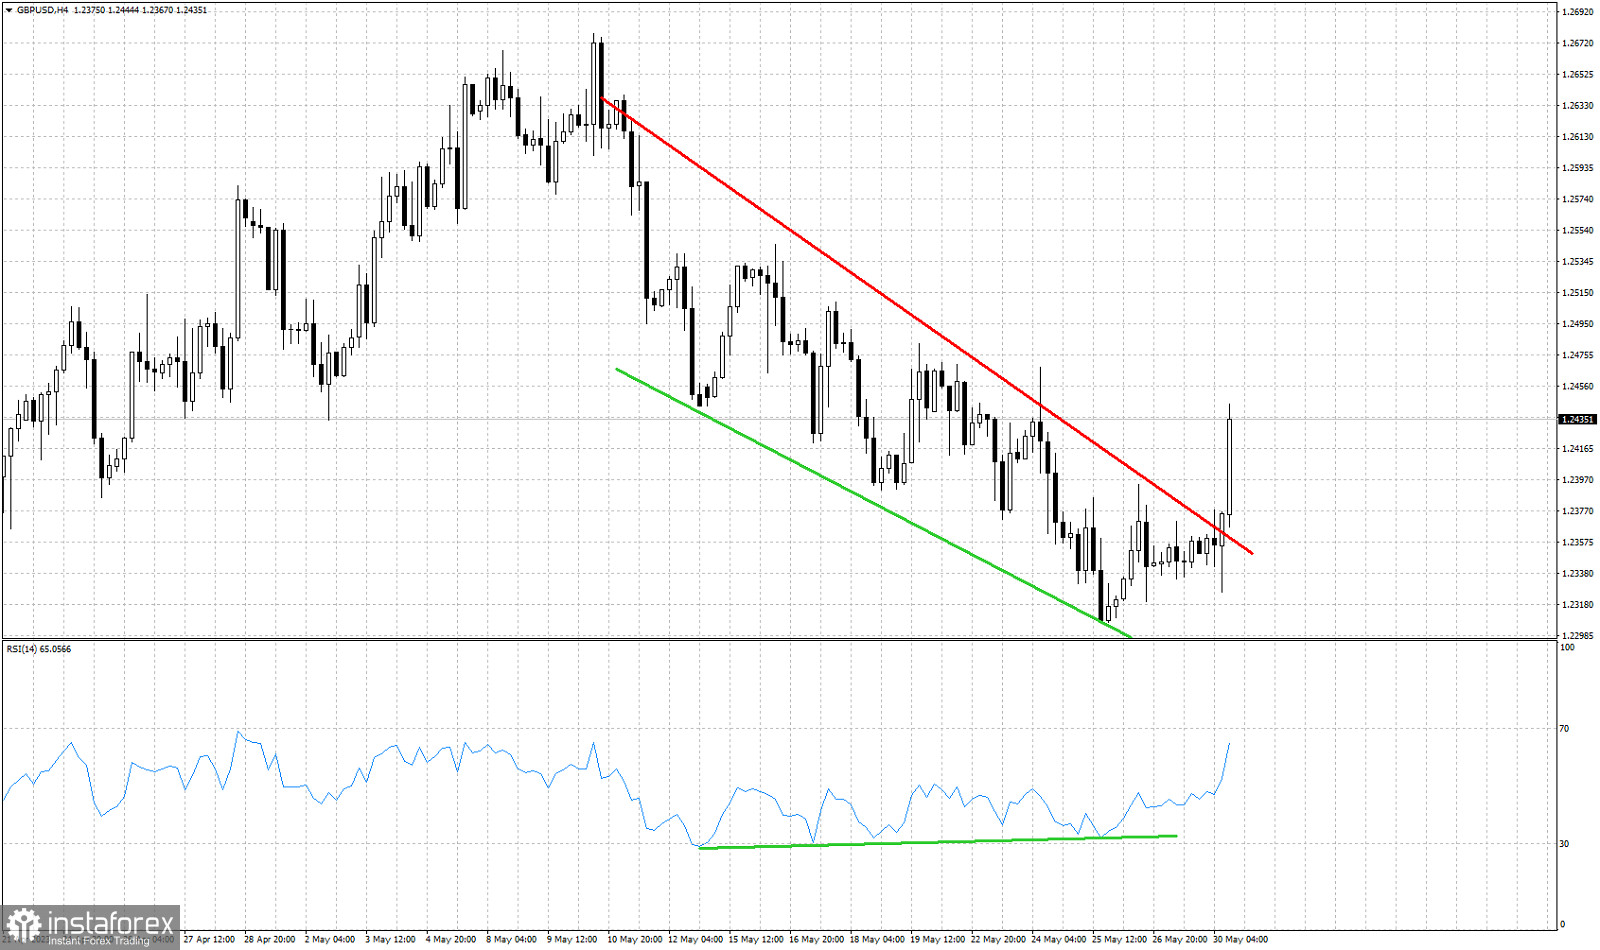
Red line- resistance
green lines- bullish RSI divergence
GBPUSD is providing a bullish reversal signal. Price has broken out of the downward sloping wedge pattern. GBPUSD is breaking above the red downward sloping trend line. The bullish RSI divergence combined with the break out above the red trend line, suggest that a new upward wave is starting. GBPUSD is now trading around 1.2435 having already reached the 38% Fibonacci retracement of the entire decline from 1.2678. There is important Fibonacci resistance at 1.2450. A rejection and pull back to form a higher low is very possible. Support is found at recent low of 1.2326. As long as price is above this level, we expect GBPUSD to continue higher.
 English
 Русский
 Bahasa Indonesia
 Bahasa Malay
 ไทย
ไทย Español
 Deutsch
 Български
 Français
 Tiếng Việt
 中文
中文 বাংলা
বাংলা हिन्दी
 Čeština
 Українська
 Română

