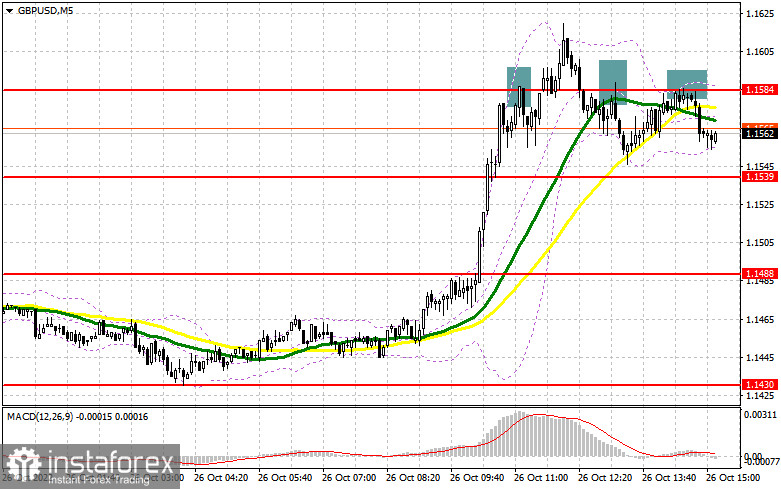
In my morning review, I mentioned the level of 1.1584 and recommended entering the market from there. Let's analyze the situation on the 5-minute chart. The pound continued its rapid rise which I mentioned in my morning review. In the course of an uptrend, bulls approached the resistance area of 1.1584 where the pair came to a halt. A false breakout of this level served as a good sell signal and resulted in a downward movement of 40 pips. The technical setup has changed in the second half of the day. 
For long positions on GBP/USD:
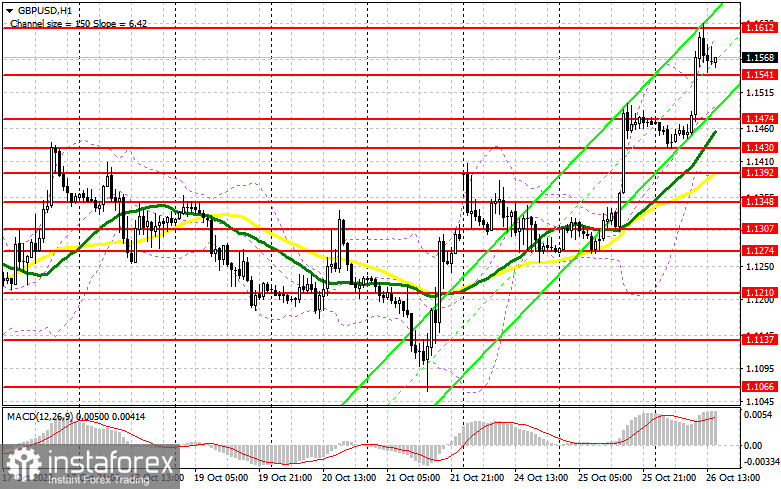
The data on new home sales in the US will set the tone in the second half of the day. If the report turns out to be below the forecast, bulls may put all their effort into pushing the price up and breaking through the new resistance of 1.1612. On the other hand, the US dollar may strengthen if the report on new home sales shows that the US real estate market was stable in September. If so, only a false breakout of 1.1541 formed in the first half of the day will generate a buy signal. Then a retest of 1.1612 should follow. Without it, bulls will not be able to develop a further uptrend. The bullish trend will be confirmed only when the pair breaks above this range. A breakout of 1.1612 and its downward retest will open the way towards the high of 1.1679 and then 1.1726 where buyers may lose control. The level of 1.1757 will serve as the next upward target. If the price hits this level, this will indicate that bears have given up. Therefore, I recommend taking profit at this point. If GBP/USD declines and bulls are idle at 1.1541, the pound will come under pressure. This will pave the wave to the lower boundary of the ascending channel at 1.1474. You can buy the pair at this level only after a false breakout. Long positions on GBP/USD right after a rebound can be opened at 1.1430 or at a low of 1.1392, keeping in mind a possible intraday correction of 30-35 pips.
For short positions on GBP/USD:
Bears are panicking and trading very cautiously as we can see on the chart. They hesitate to enter the market even during sharp upside moves. However, it is hard to say whether the demand for risk assets will persist. Anyway, this bull market is unlikely to continue for a long time. Bears need to do their best to protect the level of 1.1612 that was formed in the first half of the day. If GBP/USD rises on weak US macroeconomic data, a false breakout of this level will create a sell signal, bearing in mind its possible correction to the support of 1.1541. A break and an upside retest of this range will form a good entry point to sell the pound with the next target found at the low of 1.1474. The level of 1.1430 will act as a lower target where I recommend profit taking. In case GBP/USD advances and bears are idle at 1.1612 in the second half of the day, bulls will remain in control of the market. This may send the pair up to the new high of 1.1679. Only its false breakout will create an entry point for going short, considering a possible downward movement of the pair. If nothing happens there as well, the price may surge to the high of 1.1726 where I recommend selling the pair right after a rebound, keeping in mind a possible intraday correction of 30-35 pips.

COT report
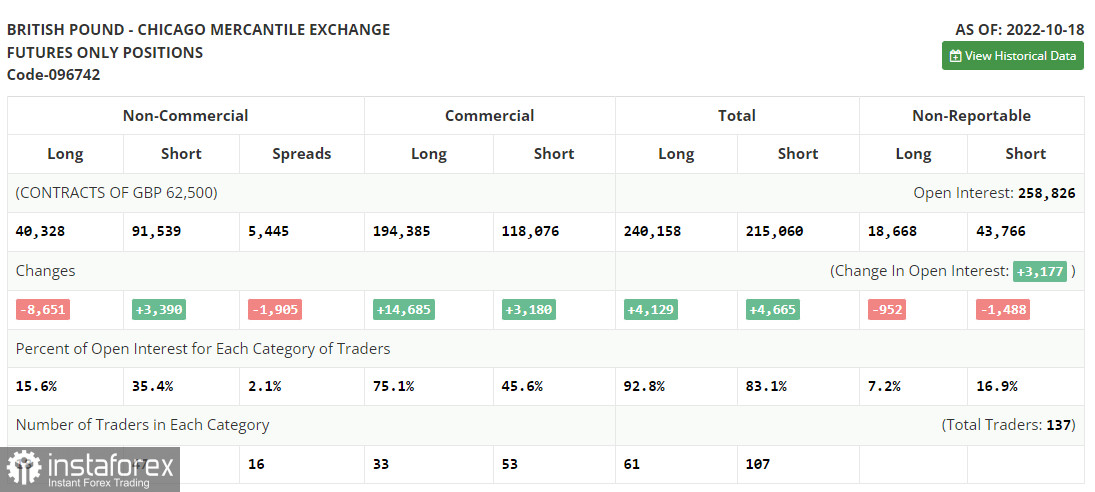
The Commitment of Traders report for October 18 showed a sharp drop in long positions and a rapid rise in the short ones. The resignation of Liz Truss and the appointment of Rishi Sunak as a new prime minister supported the British pound. At the same time, accelerated inflation in the UK made investors doubt that the economy is able to withstand all the headwinds ahead, including the cost-of-living crisis, the energy crisis, and high interest rates. Recently, the UK has also reported a rapid decline in retail sales, the main driver of economic growth. This is additional proof that UK households are struggling with rising prices and have no wish to spend money. Unless the UK government finds a solution to these problems, the pound will stay under pressure. According to the latest COT report, long positions of the non-commercial group of traders declined by 8,651 to 40,328 while short positions went up by 3,390 to 91,539. As a result, the non-commercial net position stayed negative and increased to -51,211 from -39,170. The weekly closing price went higher to 1.1332 from 1.1036.

Indicator signals:
Moving Averages
Trading above the 30- and 50-day moving averages indicates the bullish market.
Please note that the time period and levels of the moving averages are analyzed only for the H1 chart, which differs from the general definition of the classic daily moving averages on the D1 chart.
Bollinger Bands
In case of a decline, the lower band of the indicator at 1.1392 will serve as support.
Description of indicators:
• A moving average of a 50-day period determines the current trend by smoothing volatility and noise; marked in yellow on the chart;
• A moving average of a 30-day period determines the current trend by smoothing volatility and noise; marked in green on the chart;
• MACD Indicator (Moving Average Convergence/Divergence) Fast EMA with a 12-day period; Slow EMA with a 26-day period. SMA with a 9-day period;
• Bollinger Bands: 20-day period;
• Non-commercial traders are speculators such as individual traders, hedge funds, and large institutions who use the futures market for speculative purposes and meet certain requirements;
• Long non-commercial positions represent the total number of long positions opened by non-commercial traders;
• Short non-commercial positions represent the total number of short positions opened by non-commercial traders;
• The non-commercial net position is the difference between short and long positions of non-commercial traders.
 English
 Русский
 Bahasa Indonesia
 Bahasa Malay
 ไทย
ไทย Español
 Deutsch
 Български
 Français
 Tiếng Việt
 中文
中文 বাংলা
বাংলা हिन्दी
 Čeština
 Українська
 Română

