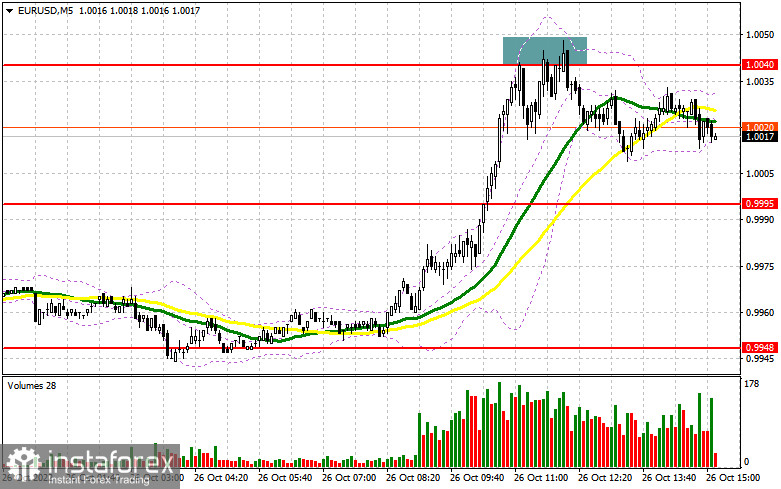
In my previous forecast, I drew your attention to the level of 1.0040 and recommended entering the market from it. Let's have a look at the 5-minute chart and analyze the situation. The price sharply dropped below parity without a reverse top/bottom test. As a result, traders refrained from opening long positions. However, there were some good sell entry points at 1.0040, which pushed the pair down by more than 35 pips. In the second half of the day, the technical picture has not changed.

Long positions on EUR/USD:
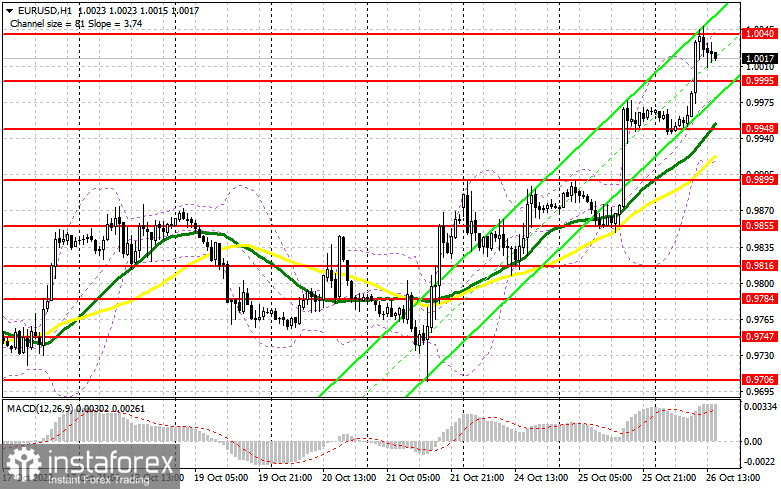
The markets are waiting for the data on the US New Home Sales, as a decline of this indicator may lead to a sharp uptrend in the euro to the monthly highs, allowing bulls to fix the price above parity. If we see strong figures, investors are likely to lock in profits, which may drag the pair to parity. The proposed trading plan is based on it. Definitely, it would be better to enter the market after the EUR/USD pair declines and a false breakout is formed at the resistance level of 0.9995, which now acts as support. That will give a signal to open long positions, counting on the further development of the uptrend and a retest to the resistance at 1.0040. If this level is broken through and tested top/bottom amid weak US statistics and shrinking Goods Trade Balance, will push it to a new monthly high at 1.0084, opening the way to 1.0118. The next target is located in the area of 1.0154, where I recommend locking in profits. If the EUR/USD pair declines during the US session and we see weak activity from bulls at 0.9995, bulls may start to take profits before the important meeting of the European Central Bank, the results of which will be published tomorrow. In this case, only a false breakout at the support level of 0.9948 may become a reason to buy the euro. One may open long positions on a rebound from support at 0.9899, or lower near the low of 0.9855, allowing an upward intraday correction of 30-35 pips.
Short positions on EUR/USD:
Bears continue to leave the market amid weak US economic data, which indicate an impending recession in the economy. As long as the pair is trading below 1.0040, the pressure on the pair is likely to persist. This may lead to a larger sell-off in the pair. However, bears need to regain control of the parity level today. if the price makes a false breakout of the resistance level of 1.0040, similar to the one that was analyzed above, would be a good option to sell the European currency. If the price fails to fix at 1.0040, the euro may move down to the area of 0.9995. If the pair breaks through and fixes below this range, as well as a reversal test from the bottom upward, gives an additional sell signal. Bulls' Stop Loss orders may be triggered and the euro can drop to 0.9948, where traders may lock in profits. The price may move above this level only after strong US statistics. If the EUR/USD pair goes up during the European session, and bears appear to show weak activity at 1.0040, the pair is likely to start another rally. In such a case, it would be better to postpone selling the euro until it the price reaches 1.0084. If a false breakout is formed there, it may give a new entry point into short positions. It is possible to sell the euro on a rebound from the high of 1.0118, or higher from 1.0154, allowing a downward correction of 30-35 pips.

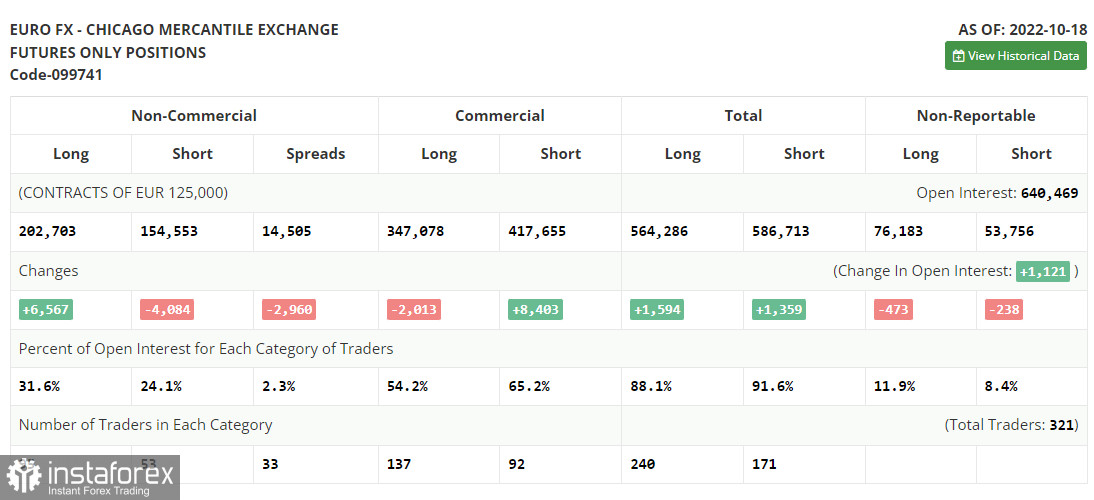
The COT report for October 18 logged a sharp decline in short positions and an increase in long positions. Obviously, the US dollar is not in such high demand as it used to be, as there are more and more signs of the economy sliding into recession due to the ultra-aggressive monetary policy of the Federal Reserve, which is likely to continue its aggressive policy. Last week, it was reported that the housing market continued to contract, and this week we saw that Manufacturing PMI and Services PMI declined. This does not give the US dollar strength to fight the growing demand for the European currency, which continues to gain weight amid promises of the European Central Bank to continue to aggressively raise interest rates in order to fight inflation. In September, it slowed down and remained below 10.0%. The COT report showed that long non-commercial positions rose by 6,567 to 202,703, while short non-commercial positions fell by 4,084 to 154,553. For the week, total non-profit net positioning remained positive at 48,150, against 37,499 the week before. This indicates that investors are taking advantage of the momentum and continuing to buy the cheap euro below parity and accumulate long positions, counting on the end of the crisis and on the pair's long-term recovery. The weekly closing price rose to 0.9895 against 0.9757.

Indicator signals:
Moving averages
The pair is trading above the 30- and 50-day moving averages, indicating that the euro attempts to rise again.
Note: The period and prices of moving averages are considered by the author on hourly chart H1 and differ from the common definition of classic daily moving averages on daily chart D1.
Bollinger Bands
In the pair declines, the lower boundary of the indicator at 0.9930 will act as support.
Description of indicators
- Moving average defines the current trend by smoothing out market volatility and noise. Period 50. Marked in yellow on the chart.
- Moving average defines the current trend by smoothing out market volatility and noise. Period 30. Marked in green on the chart.
- MACD (Moving Average Convergence/Divergence) indicator. Fast EMA 12. Slow EMA 26. SMA 9
- Bollinger Bands. Period 20
- Non-commercial traders are speculators, such as individual traders, hedge funds, and large institutions, which use the futures market for speculative purposes and meet certain requirements.
- Long non-commercial positions represent the total long open position of non-commercial traders.
- Short non-commercial positions represent the total short open position of noncommercial traders.
- Total non-commercial net position is the difference between short and long positions of non-commercial traders.
 English
 Русский
 Bahasa Indonesia
 Bahasa Malay
 ไทย
ไทย Español
 Deutsch
 Български
 Français
 Tiếng Việt
 中文
中文 বাংলা
বাংলা हिन्दी
 Čeština
 Українська
 Română

