NZD/USD:

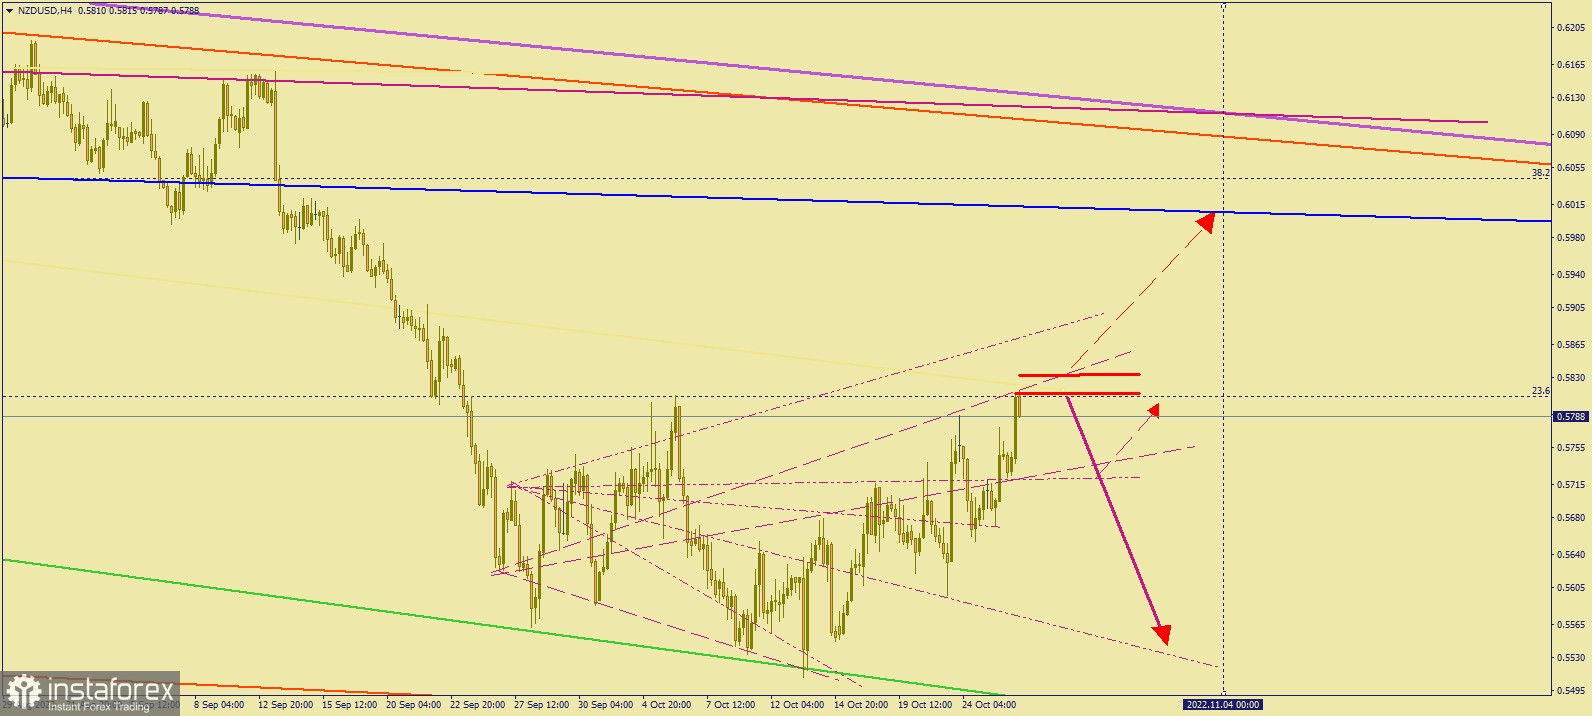
The chart shows the movement of #NZD/USD on the 4-hour (H4) chart.
Quotes reached the lower border of the resistance area of 0.5809, which is shown on the chart as two parallel lines.
This area determines the dynamics of the trend for the coming days.
However, there is a chance for a reversal towards 0.5530.
And in case of a breakdown of the upper border of the resistance area of 0.5827, the pair will rush to a new target, that is, 0.6005.
Good luck!
 English
 Русский
 Bahasa Indonesia
 Bahasa Malay
 ไทย
ไทย Español
 Deutsch
 Български
 Français
 Tiếng Việt
 中文
中文 বাংলা
বাংলা हिन्दी
 Čeština
 Українська
 Română

