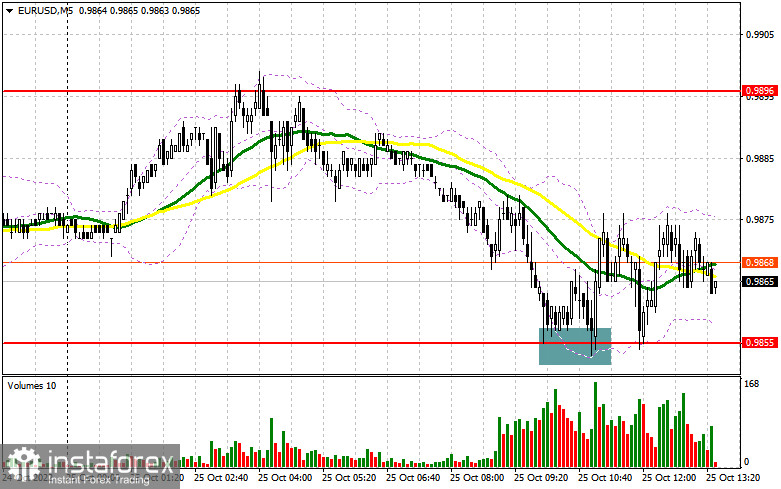
In the morning article, I turned your attention to the level of 0.9855 and recommended making decisions with this level in focus. Now, let's look at the 5-minute chart and figure out what actually happened. A drop and a false breakout of this level gave a buy signal. However, the pair failed to rise considerably. The Ifo Business Climate indicator for Germany was in line with forecasts. So, it did not trigger any market movements. At the time of writing the article, the euro appreciated only by 15 pips. For the second half of the day, the technical outlook remained unchanged.

When to open long positions on EUR/USD:
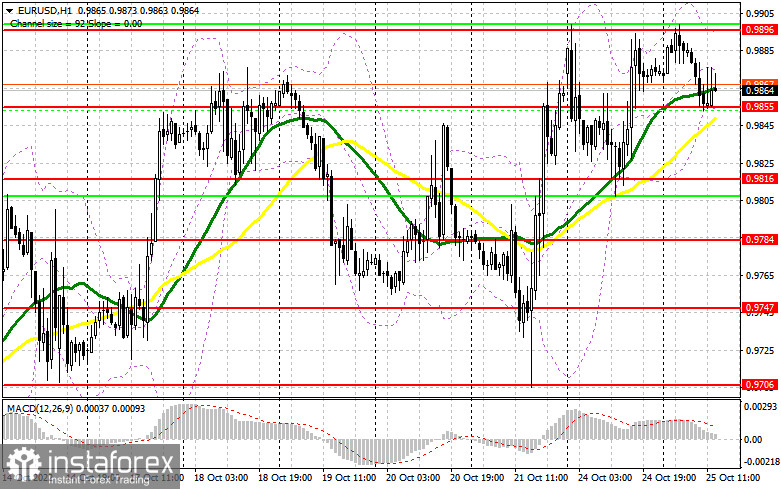
The euro is trapped in the sideways channel. Bulls have failed to push the pair to the nearest resistance level of 0.9896. This is why traders stay alert. In the afternoon, the US Consumer Confidence Index and Treasury Secretary Janet Yellen's speech are on tap. Analysts believe that the index is likely to be negative. The US dollar may face bearish pressure as it was yesterday. The euro is sure to take advantage of it. It is better to consider long positions after a decline to 0.9855 where the moving averages are passing in positive territory. Only a false breakout of this level will generate a new buy signal with the prospect of a further upward correction. At the same time, the pair may approach the resistance level of 0.9896, which has already been tested three times. A breakout and a downward test of this level will open the path to 0.9948. If so, the pair could climb to 0.9990. A more distant target will be the 1.0040 level. Should the pair reach this level, it will indicate a change in the market sentiment. I recommend locking in profits there. If EUR/USD declines during the US session and bulls show no activity at 0.9855, bears may regain control. As a reminder, this level has been tested at least 4 times today. Only a false breakout of the next support level of 0.9816 will give a buy signal. You can buy EUR/USD immediately at a bounce from the support level of 0.9784 or 0.9747, keeping in mind an upward intraday correction of 30-35 pips.
When to open short positions on EUR/USD:
Sellers are exerting pressure on the euro. However, they are unable to push it down significantly. In the second half of the day, they may lose the upper hand if the US macro stats are disappointing. The main task for today is to keep the euro in the sideways channel. It would be appropriate to open short positions after a false breakdown of the nearest resistance level of 0.9896. The pair failed to reach this level during the European session. An unsuccessful consolidation at 0.9896 will push the euro down to 0.9855, the middle of the sideways channel formed yesterday. A breakout below this level and an upward test will provide an additional sell signal. Bulls will have to close their Stop Loss orders. The euro may decrease to 0.9816 where I recommend locking in profits. This scenario may come true only if the US fresh economic reports are positive. On top of that, Christopher Waller is scheduled to deliver a speech. If he makes hawkish comments, it may increase pressure on the pair. If EUR/USD rises during the European session and bears show no energy at 0.9896, the pair is likely to jump significantly. If so, it is better to cancel short positions until a false breakout of 0.9948 takes place. You can sell EUR/USD immediately at a bounce from 0.9990 or 1.0040, keeping in mind a downward intraday correction of 30-35 pips.

COT report
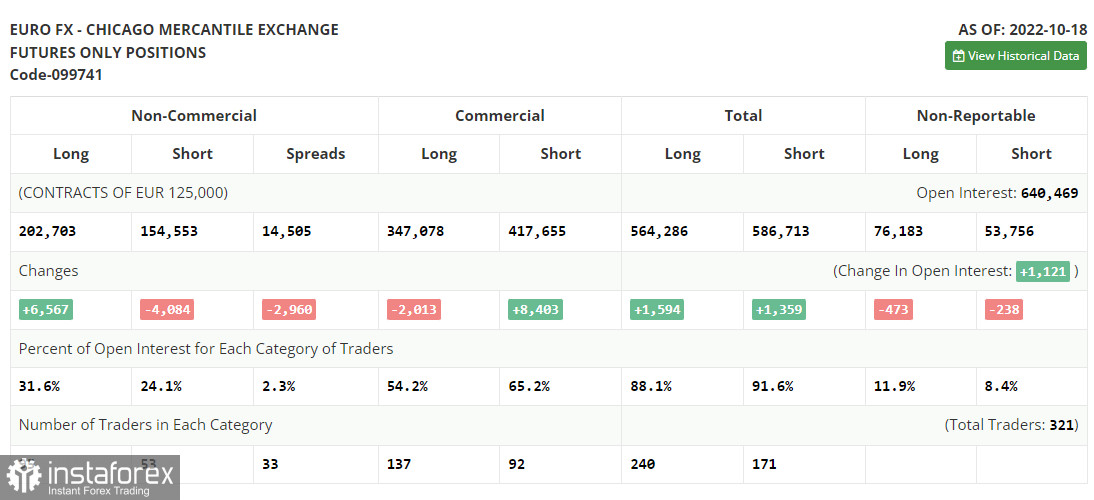
The COT report from October 18 logged a drop in both long and short positions. Demand for the US dollar is falling amid more and more signs of the economic recession caused by extremely aggressive monetary policy tightening conducted by the Federal Reserve. Last week, it became known that the housing market continued falling. This week, the US reported a significantly lower business activity in the services sector. This will hardly support the greenback since the demand for the euro is rapidly rising amid the ECB's promises to continue its hawkish policy to curb surging inflation. Notably, in September, the eurozone inflation slackened and remained below 10.0%. The COT report unveiled that the number of long non-commercial positions increased by 6,567 to 202,703, while the number of short non-commercial positions decreased by 4,084 to 154,553. At the end of the week, the total non-commercial net position remained positive at 48,150 against 37,499 a week earlier. This indicates that investors are benefiting from the situation and continue to buy the cheap euro below parity. They are also accumulating long positions supposing that the crisis will end soon and the pair will recover in the long term. The weekly closing price rose to 0.9895 from 0.9757.

Indicators' signals:
Trading is carried out above the 30 and 50 daily moving averages. It indicates that the bulls are making efforts to take the upper hand.
Moving averages
Note: The period and prices of moving averages are considered by the author on the H1 (1-hour) chart and differ from the general definition of the classic daily moving averages on the daily D1 chart.
Bollinger Bands
If EUR/USD moves up, the indicator's upper border at 0.9896 will act as resistance.
Description of indicators
- Moving average (moving average, determines the current trend by smoothing out volatility and noise). Period 50. It is marked yellow on the chart.
- Moving average (moving average, determines the current trend by smoothing out volatility and noise). Period 30. It is marked green on the chart.
- MACD indicator (Moving Average Convergence/Divergence — convergence/divergence of moving averages) Quick EMA period 12. Slow EMA period to 26. SMA period 9
- Bollinger Bands (Bollinger Bands). Period 20
- Non-commercial speculative traders, such as individual traders, hedge funds, and large institutions that use the futures market for speculative purposes and meet certain requirements.
- Long non-commercial positions represent the total long open position of non-commercial traders.
- Short non-commercial positions represent the total short open position of non-commercial traders.
- Total non-commercial net position is the difference between the short and long positions of non-commercial traders.
 English
 Русский
 Bahasa Indonesia
 Bahasa Malay
 ไทย
ไทย Español
 Deutsch
 Български
 Français
 Tiếng Việt
 中文
中文 বাংলা
বাংলা हिन्दी
 Čeština
 Українська
 Română

