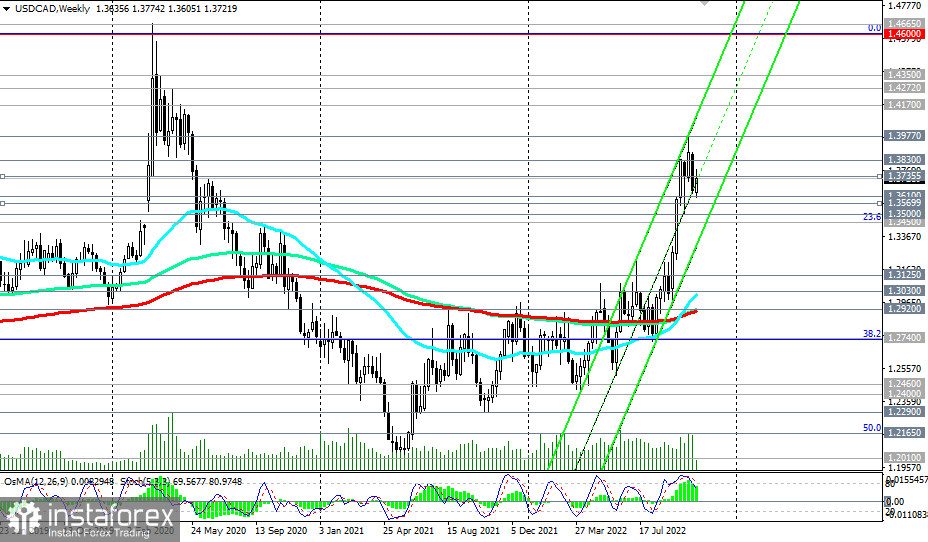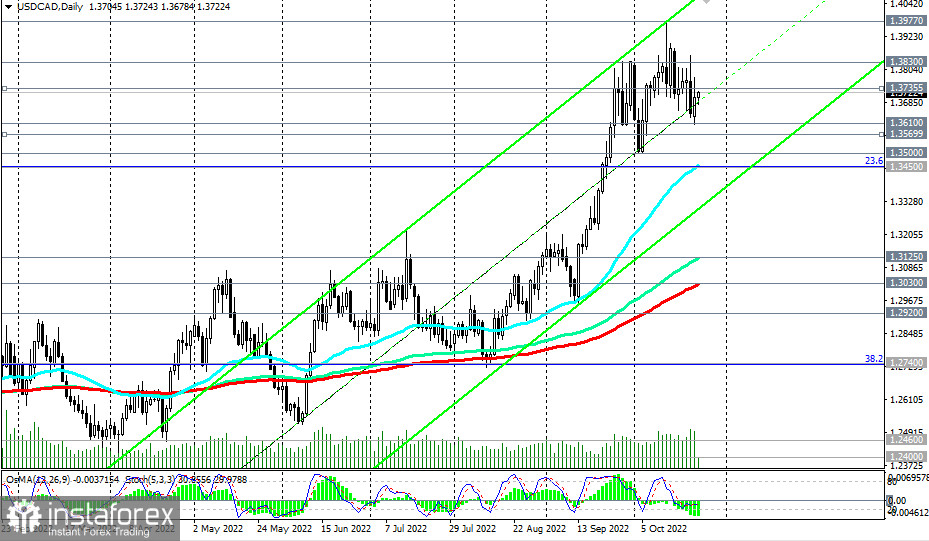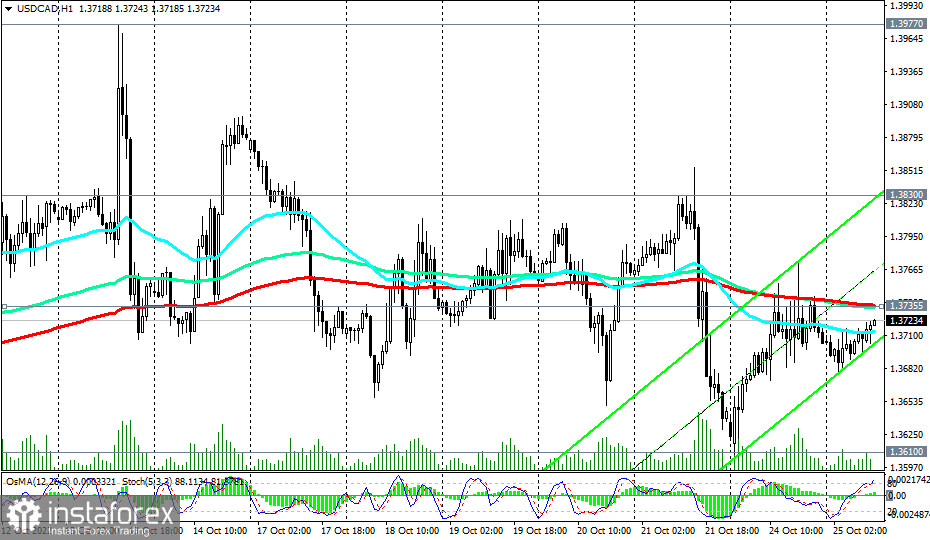
USD/CAD is in the bull market zone, above the key support levels 1.3030 (200 EMA on the daily chart), 1.2920 (200 EMA on the weekly chart). As of writing, the pair is trading near 1.3725. There will probably be an attempt to break through the short-term resistance level 1.3735 (200 EMA on the 1-hour chart) with subsequent growth towards the local resistance levels 1.3800, 1.3830, 1.3977 (high since June 2020 and this month).

In an alternative scenario and in case of a rebound from the resistance level 1.3735, USD/CAD will fall to the support levels 1.3610, 1.3570 (200 EMA on the 4-hour chart). A deeper correction is possible up to the support levels 1.3500, 1.3450 (50 EMA on the daily chart and the 23.6% Fibonacci level of the downward correction in the USD/CAD growth wave from the level of 0.9700 to the level of 1.4600).

In general, the USD/CAD bullish trend prevails, and given the strong upward momentum, it is logical to assume further growth. The driver of strong movements in the USD/CAD pair will be tomorrow's publication (at 14:00 GMT) of the decision of the Bank of Canada on the interest rate.
Support levels: 1.3610, 1.3570, 1.3500, 1.3450, 1.3125, 1.3030, 1.2920
Resistance levels: 1.3735, 1.3800, 1.3830, 1.3900, 1.3977, 1.4000
Trading Tips
Sell Stop 1.3670. Stop-Loss 1.3750. Take-Profit 1.3610, 1.3570, 1.3500, 1.3450, 1.3125, 1.3030, 1.2920
Buy Stop 1.3750. Stop-Loss 1.3670. Take-Profit 1.3800, 1.3830, 1.3900, 1.3977, 1.4000
 English
 Русский
 Bahasa Indonesia
 Bahasa Malay
 ไทย
ไทย Español
 Deutsch
 Български
 Français
 Tiếng Việt
 中文
中文 বাংলা
বাংলা हिन्दी
 Čeština
 Українська
 Română

