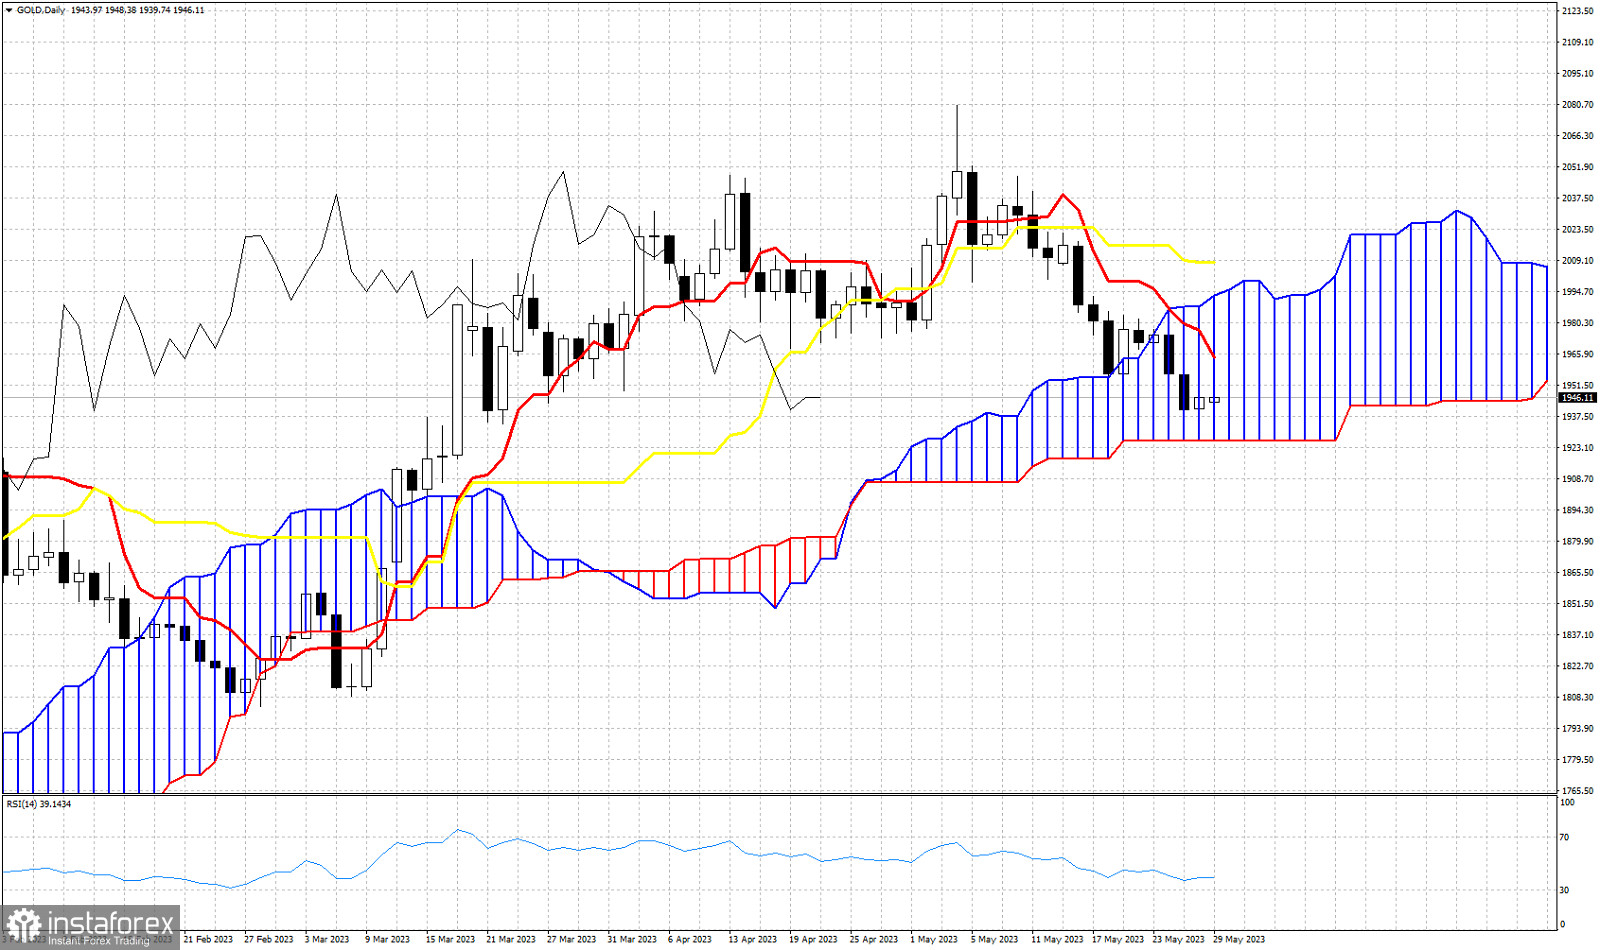
Gold price is trading around $1,945. In the Daily chart trend according to the Ichimoku cloud indicator is neutral as price is trading inside the Kumo (cloud). The Chikou span (black line indicator) is below the candlestick pattern (bearish). Price is below both the tenkan-sen (red line indicator) and the kijun-sen (yellow line indicator). This is a sign of vulnerability. The first sign of weakness came when price broke below the kijun-sen. The second sign of weakness came when price broke inside the Kumo. Price remains below both the tenkan-sen and kijun-sen confirming that price remains vulnerable to more downside. Support and short-term target is at the lower cloud boundary at $1,926. A break below this level would change trend to bearish.
 English
 Русский
 Bahasa Indonesia
 Bahasa Malay
 ไทย
ไทย Español
 Deutsch
 Български
 Français
 Tiếng Việt
 中文
中文 বাংলা
বাংলা हिन्दी
 Čeština
 Українська
 Română

