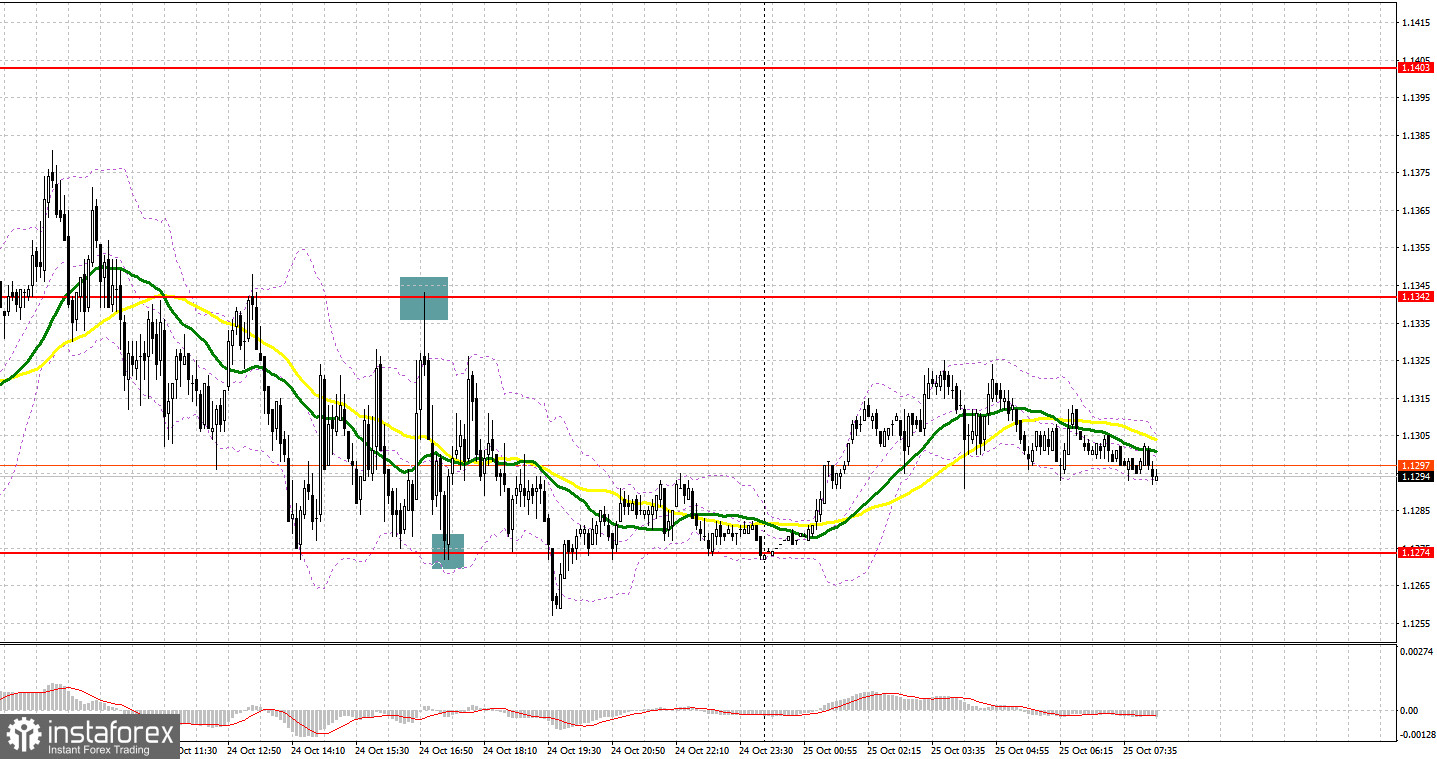
Several excellent market entry signals were formed yesterday. Let's take a look at the 5-minute chart and figure out what happened. I paid attention to the 1.1302 level in my morning forecast and advised making decisions on entering the market there. The decline and false breakout in the area of 1.1302 were not long in coming, which led to a buy signal and the pound's growth by more than 40 points. Then the pair was under pressure again after we received disappointing data on PMI and the level of 1.1302 was broken through, but it was not possible to get a sell signal there. The technical picture was revised in the afternoon. A false breakout in the resistance area of 1.1342 gave a sell signal, after which the pair went down about 50 points. Bulls actively protecting the important support at 1.1274 provided a good entry point for buying the pound in the middle of the US session, which led to an increase of more than 30 points.

COT report:
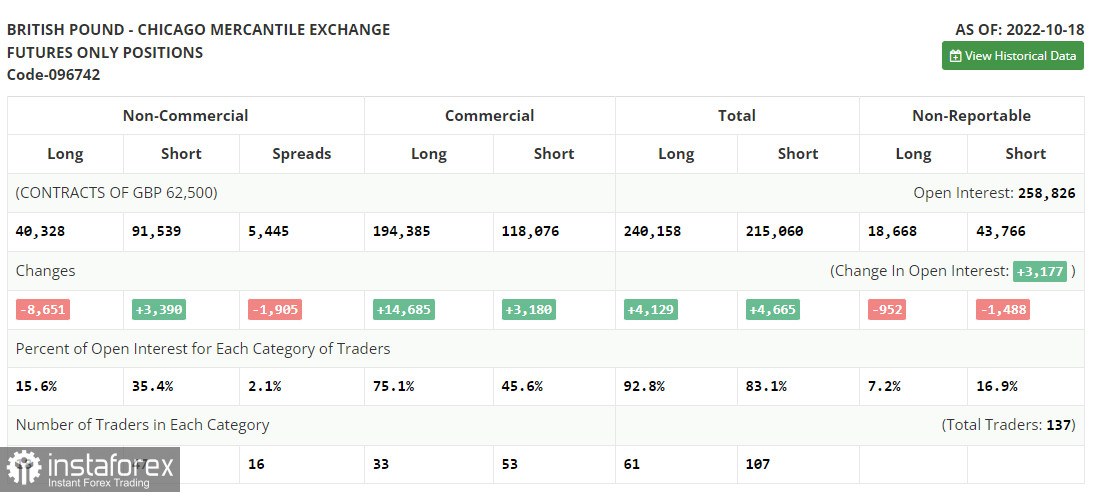
Before analyzing the technical picture of the pound, let's look at what happened in the futures market. The Commitment of Traders (COT) report for October 18 logged a sharp reduction in long positions and an increase in shorts. The resignation of British Prime Minister Liz Truss and the appointment of Rishi Sunak to her post had a positive effect on the British pound, but rising inflation in the UK did not allow investors to fully believe that the economy would be able to endure all that awaits it in the near future: an increase in the cost of living crisis, an increase in the energy crisis and high interest rates. Also, there was a sharp decline in retail sales most recently in the UK - the main engine of economic growth, which once again confirms the fact that households have serious problems due to high prices, discouraging any desire to spend extra money. Until the UK authorities deal with the problems and find a way out of the current situation, the pressure on the pound will continue. The latest COT report indicated that long non-commercial positions decreased by 8,651 to 40,328, while short non-commercial positions rose by 3,390 to 91,539, resulting in a slight increase in the negative non-commercial net position to -51,211 versus -39,170. The weekly closing price increased and amounted to 1.1332 versus 1.1036.

When to go long on GBP/USD:
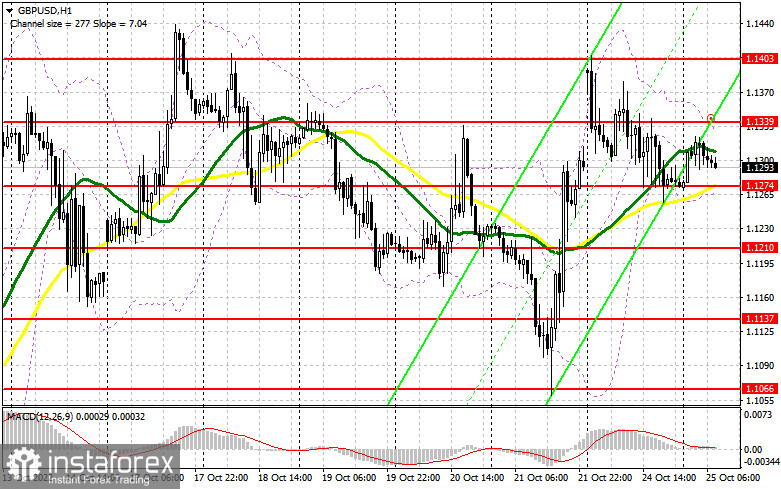
Today there are no statistics on the UK, and the report on the Industrial Orders Index (CBI) is unlikely to somehow affect the foreign exchange market. To maintain the upward potential, the bulls need to show themselves in the area of the nearest support at 1.1274. A false breakout at this level, by analogy with what I analyzed above, will lead to a buy signal with a re-exit at 1.1339, without which it will be difficult for bulls on the pound to count on building a bullish market. We can only talk about continuing the upward correction for the pair once it goes above this range. A breakthrough of 1.1339, as well as a reverse test from top to bottom, will open the way to a high of 1.1403, and there it is within easy reach to the monthly resistance of 1.1488, where it will become more difficult for the bulls to control the market. A more distant target will be the area of 1.1539, which will lead to a fairly large capitulation of the bears - I recommend taking profit there.
If the GBP/USD falls and there are no bulls at 1.1274, and this level has already been tested more than five times over the past 24 hours, then the pound will be under pressure again. If this happens, I recommend postponing longs to 1.1210. I advise you to buy there only on a false breakout. You can open long positions on GBP/USD immediately for a rebound from 1.1137, or in the low area of 1.1066 with the goal of correcting 30-35 points within the day.
When to go short on GBP/USD:
It is quite possible that the new reforms of the new British Prime Minister Rishi Sunak will be able to revive the pound and give it strength, however, the actions of the Bank of England aimed at suppressing inflation and, accordingly, economic growth rates are a serious anchor for major players. An important task for today is to protect the resistance at 1.1339, formed on the basis of yesterday. Bears should not release the pair outside this range, as this will provoke new longs, allowing the bulls to strengthen their position in the market.
In case GBP/USD grows, forming a false breakout at 1.1339 creates a sell signal, counting on bringing back the bearish trend and a decrease to the nearest support at 1.1274, the breakdown of which will take place any minute. A breakthrough and reverse test from the bottom up of this range will provide an entry point for shorts with the update of the low of 1.1210. A more distant target will be the area of 1.1137, where I recommend taking profits.
In case GBP/USD grows and the bears are not active at 1.1339, then the bulls will regain control of the situation, which can push GBP/USD to rise to the area of a weekly high at 1.1403. A false breakout at this level creates an entry point into shorts, counting on a new downward movement of the pair. If traders are not active there, there may be a surge up to a high of 1.1488. There, I advise you to sell GBP/USD immediately for a rebound, based on a bounce downwards by 30-35 points within the day.

Indicator signals:
Trading is conducted in the area of 30 and 50 moving averages, which indicates problems for bulls on the pound.
Moving averages
Note: The period and prices of moving averages are considered by the author on the H1 hourly chart and differs from the general definition of the classic daily moving averages on the daily D1 chart.
Bollinger Bands
A breakthrough of the indicator's upper border in the area of 1.1339 will lead to a new wave of growth of the pound.
Description of indicators
- Moving average (moving average, determines the current trend by smoothing out volatility and noise). Period 50. It is marked in yellow on the chart.
- Moving average (moving average, determines the current trend by smoothing out volatility and noise). Period 30. It is marked in green on the chart.
- MACD indicator (Moving Average Convergence/Divergence — convergence/divergence of moving averages) Quick EMA period 12. Slow EMA period to 26. SMA period 9
- Bollinger Bands (Bollinger Bands). Period 20
- Non-commercial speculative traders, such as individual traders, hedge funds, and large institutions that use the futures market for speculative purposes and meet certain requirements.
- Long non-commercial positions represent the total long open position of non-commercial traders.
- Short non-commercial positions represent the total short open position of non-commercial traders.
- Total non-commercial net position is the difference between short and long positions of non-commercial traders.
 English
 Русский
 Bahasa Indonesia
 Bahasa Malay
 ไทย
ไทย Español
 Deutsch
 Български
 Français
 Tiếng Việt
 中文
中文 বাংলা
বাংলা हिन्दी
 Čeština
 Українська
 Română

