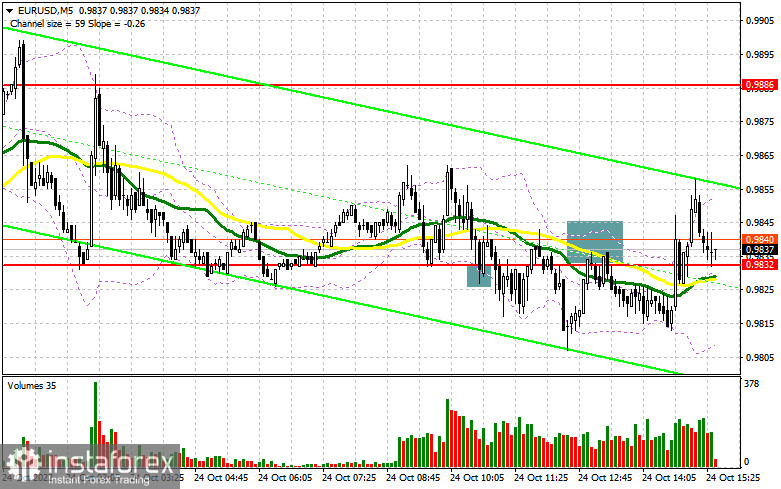
In the previous forecast, I drew your attention to the level of 0.9832 and recommended entering the market from it. Let us have a look at the 5-minute chart and analyze the situation there. The pair moved down and formed a false breakout at this level, creating a buy signal. However, the price failed to rise. The weak data from the eurozone harmed the bullish potential of the pair and it did not show any loss. A breakthrough and a reverse test of 0.9832 gave a sell signal. After the price declined by 15 pips, the pressure on the euro eased quickly. In the second half of the day, the technical picture changed.

Long positions on EUR/USD:
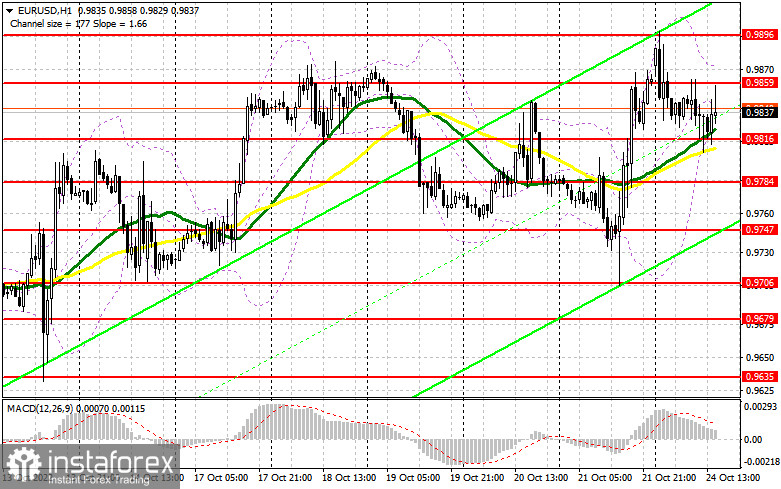
The markets expect similar data in the US in the afternoon. The services PMI index, the manufacturing PMI, and the PMI composite index will drive the market. The US report is likely to outperform the eurozone one, which may strengthen the US dollar. Traders will also focus on the speech of Treasury Secretary Janet Yellen. If the pair continues to decline, only a false breakout below the nearest support of 0.9816, created in the first half of the day, will help accumulate long positions, recovering the price to the resistance level of 0.9859. Perhaps, bulls will try to regain control over the market only after a breakthrough of this level and a top/bottom test, which may take place during the US session, if the US data does not meet expectations. At the same time, bullish sentiment can persist due to a more aggressive rate hike by the ECB. If Stop Loss orders of speculative bears are triggered, the pair may form an additional buy signal and send the price to the area of 0.9896. When piercing 0.9896, the price may grow to the area of 0.9948, where traders may lock in profits. If the EUR/USD pair declines and we see weak activity at 0.9816, where the moving averages pass, bulls are likely to lose control over the market. The pressure on the euro may increase. This may drag the price to the area of 0.9784. A false breakout at this level will be the best scenario to open long positions. It is better to buy the euro on a pullback only from 0.9747 or lower near 0.9706, allowing an upward intraday correction of 30-35 pips.
Short positions on EUR/USD:
Bears tried to regain control over the market after the weak data was released. However, they did not succeed. Currently, much depends on the US statistics and how the sellers will behave around the nearest resistance at 0.9859. That's why it is better to sell the euro in the afternoon, only after a false breakout and a consolidation of the price above 0.9859. This may give confidence to big players and push the euro to 0.9816. If the price fixes below this level, against the background of strong statistics, as well as a top/bottom test, like the one that was noted above, may become a reason to continue selling the euro to trigger bulls' Stop Loss orders and push the price to 0.9784. The next target is located at 0.9747, where traders may take profits. If the EUR/USD pair rises during the US session and bears show weak activity at 0.9859, bulls will try to break above the weekly high. In that case, it would be better to postpone selling the euro. One may open short positions only if a false breakout at 0.9896 is formed. Selling the EUR/USD pair on a rebound is possible from the highs of 0.9948, or higher from 0.9990, allowing a downward correction of 30-35 pips.

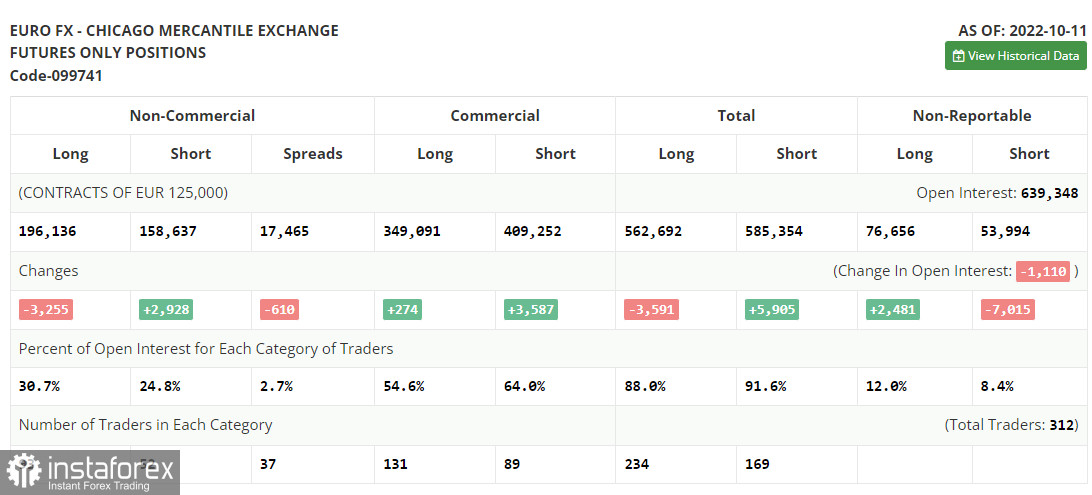
The COT report for October 11 logged a sharp decline in long positions and an increase in short positions. Traders were preparing for the US inflation and retail sales data. The Fed is having a pretty tough time dealing with rising consumer prices, as the September report showed that inflation slowed down by 0.1% year-on-year. This suggests that the aggressiveness of the Central Bank's policy will remain the same or become tougher. In the meantime, there have not been active sales of the euro below parity for quite a long time and even the developments in the geopolitical background together with the increase of the rates in the US are incapable to push the euro even lower. Therefore, one can think about buying the euro in the medium term. The COT report showed long non-commercial positions were up by 3,255 to 196,136, while short non-commercial positions rose by 2,928 to 158,637. At the end of the week, the total nonprofit net position remained positive at 37,499 against 43,682. This indicates that investors are taking advantage of the situation and continuing to buy the cheap euro below parity, as well as accumulating long positions, counting on the end of the crisis and on the pair's recovery in the long term. The weekly closing price was down to 0.9757 against 1.0053.

Indicator signals:
Moving averages
The pair is trading above the 30- and 50-day moving averages, indicating that bulls are trying to return to the market.
Note: The period and prices of moving averages are considered by the author on hourly chart H1 and differ from the general definition of classic daily moving averages on daily chart D1.
Bollinger Bands
if the price grows, the upper boundary of the indicator in the area of 0.9870 will act as resistance.
Indicators description
- Moving average defines the current trend by smoothing out market volatility and noise. Period 50. Marked in yellow on the chart.
- Moving average defines the current trend by smoothing out market volatility and noise. Period 30. Marked in green on the chart.
- MACD (Moving Average Convergence/Divergence) indicator. Fast EMA 12. Slow EMA 26. SMA 9
- Bollinger Bands. Period 20
- Non-commercial traders are speculators, such as individual traders, hedge funds, and large institutions, which use the futures market for speculative purposes and meet certain requirements.
- Long non-commercial positions represent the total long open position of non-commercial traders.
- Short non-commercial positions represent the total short open position of non-commercial traders.
- Total non-commercial net position is the difference between the short and long positions of non-commercial traders.
 English
 Русский
 Bahasa Indonesia
 Bahasa Malay
 ไทย
ไทย Español
 Deutsch
 Български
 Français
 Tiếng Việt
 中文
中文 বাংলা
বাংলা हिन्दी
 Čeština
 Українська
 Română

