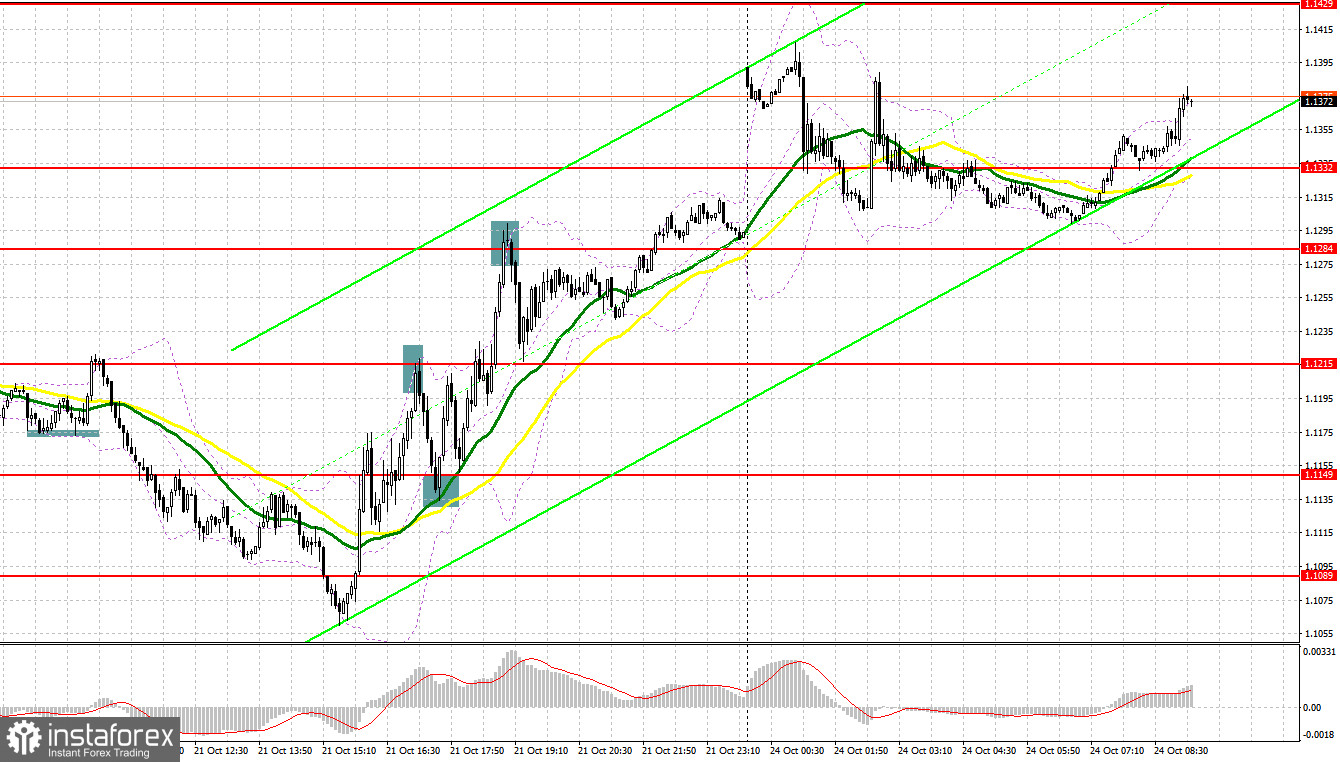
On Friday, GBP/USD formed a large number of excellent market entry points. Now let's take a look at the 5-minute chart and try to understand the developments of the currency pair. In my previous review, I turned your attention to the levels of 1.1174 and 1.1124 and recommended making decisions with these levels in focus. A price decline and a breakout of 1.1174 followed shortly after. The currency pair generated a buy signal which caused a spike of more than 40 pips. Then, GBP/USD came under selling pressure again and the second test of 1.1174 happened without being updated in the opposite direction. Hence, I could not enter into short positions. The active defence of support at 1.1124 by the bulls generated a buy signal, but the price jumped just 25 points. Later on, GBP retreated to 1.1124. In the second half of the day, the market saw a sharp climb to 1.1215 where a false breakout provided an excellent sell signal with the target at 1.1149. All in all, we managed to earn more than 50 pips in profit. The defence of 1.1149 by the buyers enabled a buy signal. The instrument recovered to 1.1215, thus giving us another 50 pips of profit. By the mid-American session, GBP/USD updated resistance at 1.1284 but failed to settle above it. As a result, the pair offered another sell signal accompanied by a 60-pips decline.

What is needed to open long positions on GBP/USD
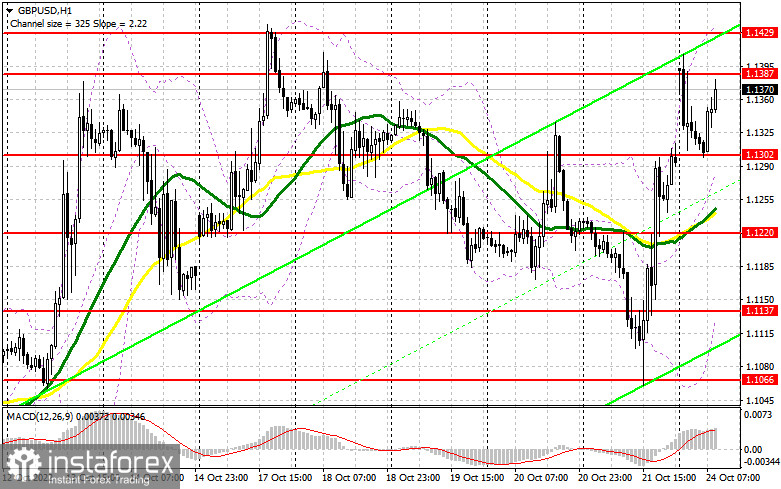
GBP buyers bought the pair at its bottom at 1.1066. Now they are keeping the nearest resistance of 1.1387 in focus. Later today, investors will get to know the UK PMIs which might cause revisions in trading plans. The market will take notice of the UK services PMIs, the manufacturing PMI, and the composite PMI. Importantly, traders will be looking for clues as to whether the service sector has been losing momentum because the service sector accounts for the lion's share in the British economy. If traders find evidence of contraction in the service sector, GBP could fall considerably against USD. Besides, make sure you don't neglect the UK composite PMI and a speech by Bank of England Deputy Governor Dave Ramsden.
In case GBP/USD declines, only a false breakout at 1.1302, the level formed as a result of the Asian trade, will provide a buy signal with the upward target at 1.1387. A breakout and a test of this level downwards could change market sentiment radically, activating the sellers' stop losses and thus, enabling the buyers to offset all losses of the last week. This price action will provide a new buy signal with traders betting on the more important target at 1.1429 and even the higher target at 1.1488. The highest target is set by the bulls at 1.1539, a one-month high. If the bulls fail the task and miss the level of 1.1302 due to weak UK PMIs, GBP will get under pressure again which will fuel active sell-offs. I would advise you to buy GBP/USD during a false breakout at about 1.1220 where moving averages are passing. They are in the buyers' favor. We could open long positions on GBP/USD at 1.1137 immediately at a dip or lower at about 1.1066, bearing in mind an intraday correction of 30-35 pips.
What is needed to open short positions on GBP/USD
The sellers managed to assert themselves at 1.1387. However, it is not enough to take control of the market. For this, they need to seize the area above 1.13. The reasonable sell scenario today will be a false breakout of resistance at 1.1387 which could happen in light of the downbeat data on the UK business activity. If so, we will have a nice entry point for sell positions with the nearest target at the support level of 1.1302. This level is the key to further price developments. A breakout and an opposite test of this area upwards will be a good set-up with a low target at 1.1220 where moving averages are passing. In this case, they are for the bulls' benefit. The lowest target is seen at 1.1137 where I recommend profit-taking. In case GBP/USD grows and the bears are not active at 1.1387, the bulls will try to enter the market, aiming to take the lead and encourage a new uptrend.
This will push GBP/USD up to 1.1429. Only a false breakout at this level will provide an entry point for short positions with a view to a new leg down. In case the bears also lack activity there, I recommend selling GBP/USD immediately at a bounce off 1.1488, bearing in mind an intraday drop of 30-35 pips.

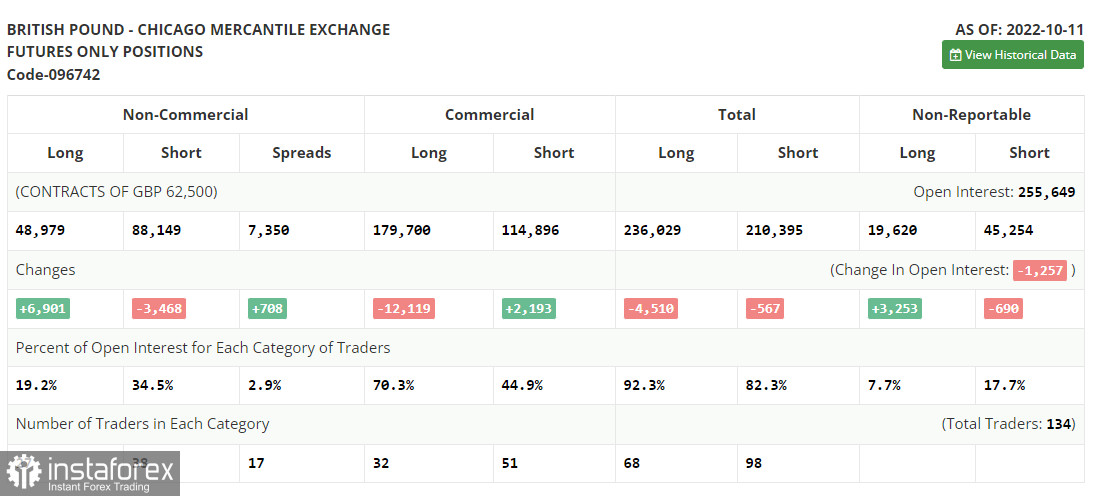
The COT report from October 11 logs a sharp contraction in short positions and growth in long ones. The intervention of the Bank of England caused drastic market moves. Now traders are betting on GBP's strength in the medium term. Recently, the British regulator decided to hit the pause button on its bond-buying program known as the QT (Quantitative Tightening) to enable recovery in the domestic bond market following a slump due to the fiscal policy of British Premier Liz Truss. However, it does not make sense to rely on a sharp growth of GBP in the medium term in the context of a looming recession and further aggressive monetary tightening by the Federal Reserve that will make the US dollar more attractive. According to the last COT report, long non-commercial positions rose by 6,901 to 48,979 contracts whereas short non-commercial positions dropped by 3,468 to 88,149 contracts. As a result, the negative value of overall non-commercial positions slightly contracted to -39,170 against -49,539 a week ago. GBP/USDS closed last week lower at 1.1036 against 1.1491 in the previous week.

Indicators' signals:
Trading is carried out above the 30 and 50 daily moving averages. It indicates that the bull are making efforts to assert themselves.
Moving averages
Note: The period and prices of moving averages are considered by the author on the H1 (1-hour) chart and differ from the general definition of the classic daily moving averages on the daily D1 chart.
Bollinger Bands
If GBP/USD declines, the indicator's lower border at 1.1155 will serve as support.
Description of indicators
- Moving average (moving average, determines the current trend by smoothing out volatility and noise). Period 50. It is marked yellow on the chart.
- Moving average (moving average, determines the current trend by smoothing out volatility and noise). Period 30. It is marked green on the chart.
- MACD indicator (Moving Average Convergence/Divergence — convergence/divergence of moving averages) Quick EMA period 12. Slow EMA period to 26. SMA period 9
- Bollinger Bands (Bollinger Bands). Period 20
- Non-commercial speculative traders, such as individual traders, hedge funds, and large institutions that use the futures market for speculative purposes and meet certain requirements.
- Long non-commercial positions represent the total long open position of non-commercial traders.
- Short non-commercial positions represent the total short open position of non-commercial traders.
- Total non-commercial net position is the difference between short and long positions of non-commercial traders.
 English
 Русский
 Bahasa Indonesia
 Bahasa Malay
 ไทย
ไทย Español
 Deutsch
 Български
 Français
 Tiếng Việt
 中文
中文 বাংলা
বাংলা हिन्दी
 Čeština
 Українська
 Română

