EUR/USD 5M

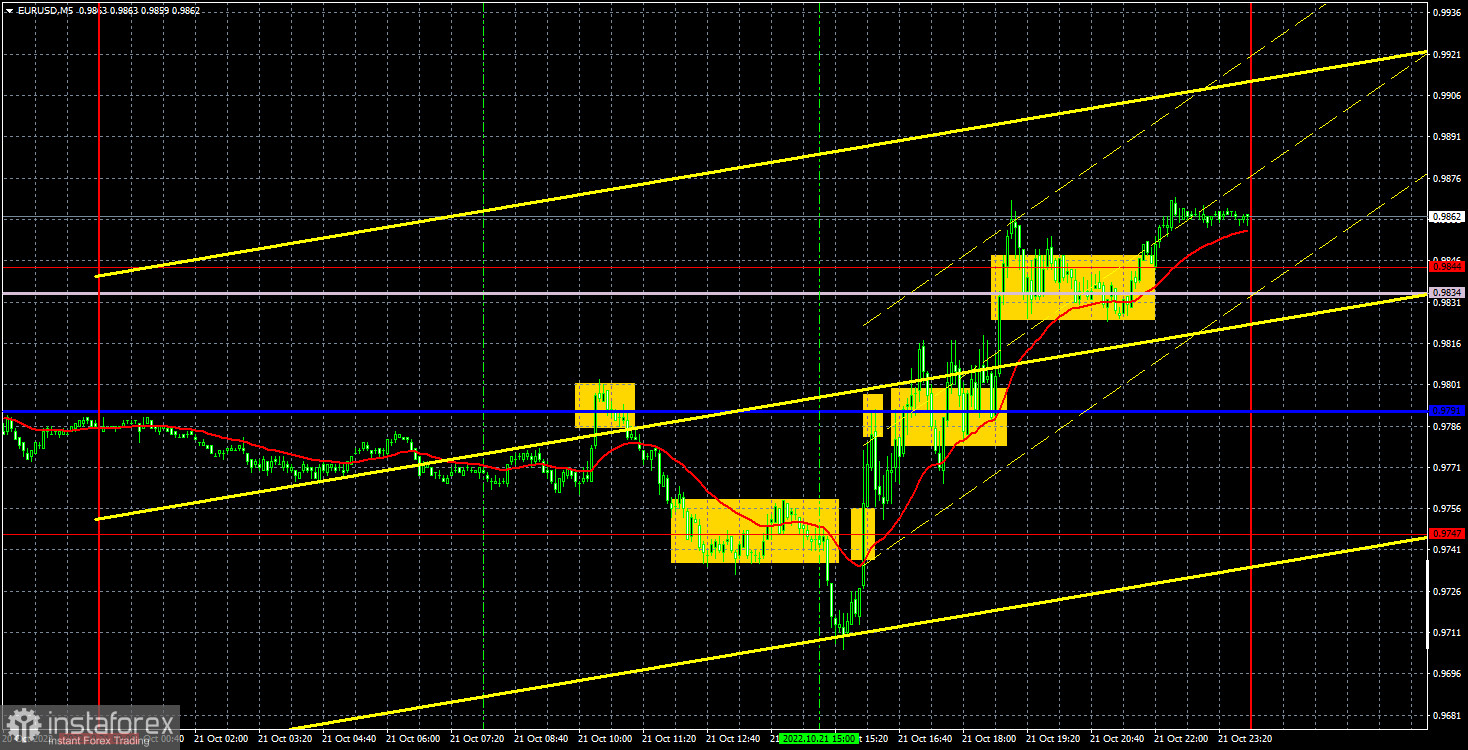
The euro/dollar pair managed to fall and rise on Friday. The same was observed a day earlier and, as on Thursday, no specific fundamental or macroeconomic reasons for this. There was not a single significant event in the US nor in the European Union and, nevertheless, the pair managed to show volatility of more than 100 points and they were enviable movements. Indeed, these movements were not as wonderful as it might seem, since the price overcame the Ichimoku indicator lines without any apparent difficulties, which should actually represent quite strong resistance. But for several days in a row, the price does not even notice them, which, unfortunately, can speak of a flat or "swing". We have already warned about the "swing" before. At this time, traders do not quite understand what to do with the euro, since it is already dangerous to sell at the current, lowest levels, and there is no reason to buy. As a result, the pair very often corrects and rolls back up and down.
Analyzing Friday's trading signals, it is very clear that the movements were not so good. The first trading signal was perhaps the most unambiguous of all. The price rebounded from the critical line, after which it dropped to the level of 0.9747 and overcame it, then went down for about 25 more points. But it did not reach the next level, so the position should have been closed at the nearest buy signal, which was formed when it settled above 0.9747. Profit amounted to about 20 points. It was possible to open long positions on the same signal, but then "songs and dances" began near the Kijun-sen line. The price overcame it both upwards and downwards several times. Therefore, a long position should have been closed as soon as possible and it is unlikely that it was possible to make good money on it. The first rebound from the critical line should not have been worked out, since the price immediately appeared near the level of 0.9747, from which it could also rebound. Another signal near Kijun-sen could have been worked out, but it most likely caused a loss, which offset most of the profit on the first two positions.
COT report:

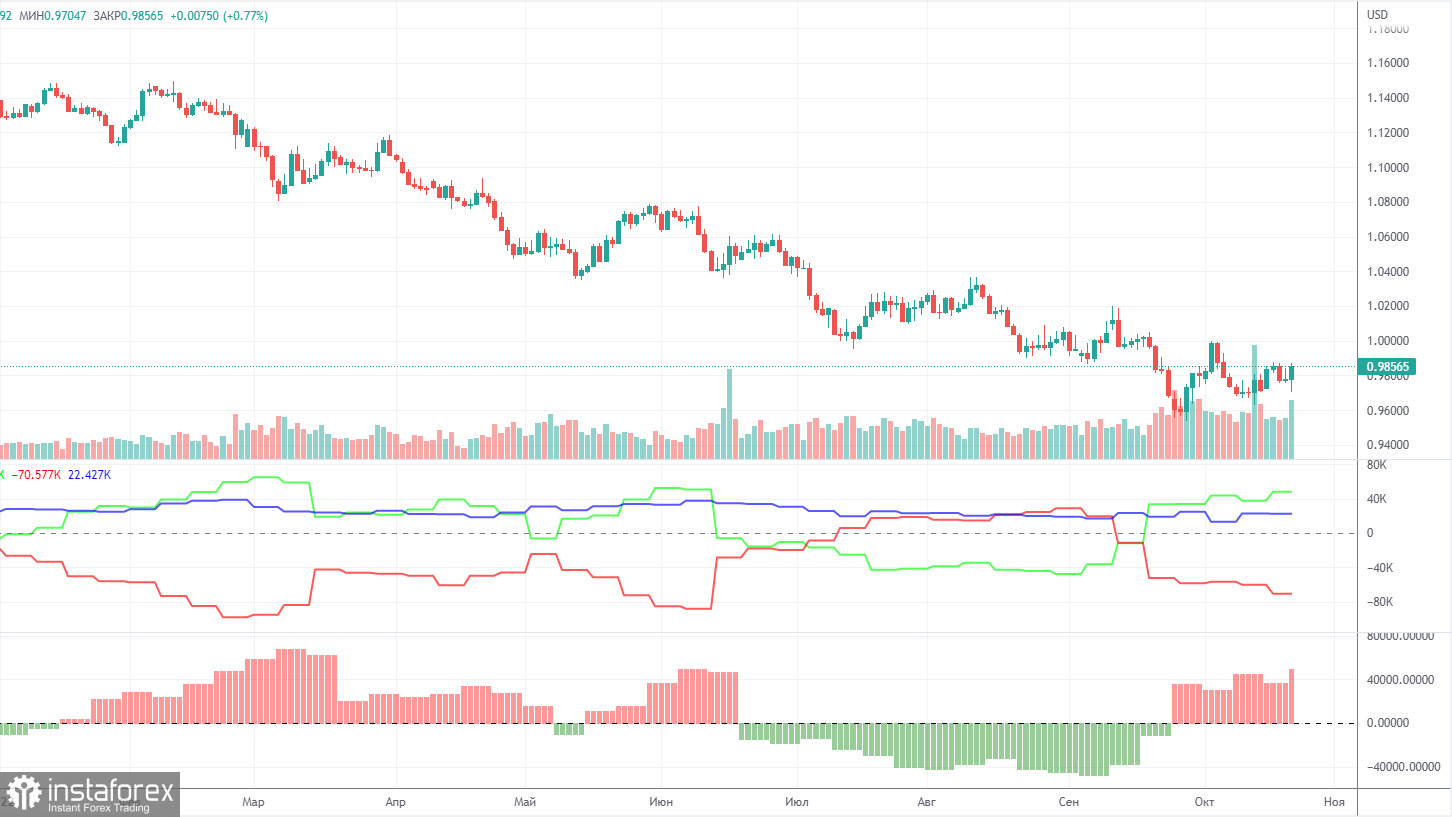
The euro Commitment of Traders (COT) reports for 2022 could be used as good examples. In the first part of the year, the reports were pointing to the bullish sentiment among professional traders. However, the euro was confidently losing value. Then, for several months, reports were reflecting bearish sentiment and the euro was also falling. Now, the net position of non-commercial traders is bullish again and the euro is still dropping. This could be explained by the high demand for the US dollar amid the difficult geopolitical situation in the world. Even if demand for the euro is rising, high demand for the greenback prevents the euro from growing. In the given period, the number of long non-commercial positions increased by 6,500, while the number of shorts decreased by 4,000. Accordingly, the net position increased by about 10,500. This fact is not of particular importance, since the euro still remains "at the bottom". At this time, commercial traders still prefer the euro to the dollar. The number of longs is higher than the number of shorts for non-commercial traders by 48,000, but the euro cannot derive any dividends from this. Thus, the net position of the non-commercial group can continue to grow further, this does not change anything. If you look at the total open longs and shorts for all categories of traders, then shorts are 22,000 more (586,000 vs 564,000). Thus, according to this indicator, everything is logical.
We recommend to familiarize yourself with:
Overview of the EUR/USD pair. October 24. ECB meeting: how much will the central bank raise the rate?
Overview of the GBP/USD pair. October 24. This week - the election of the prime minister in the UK!
Forecast and trading signals for GBP/USD on October 24. Detailed analysis of the movement of the pair and trading transactions.
EUR/USD 1H

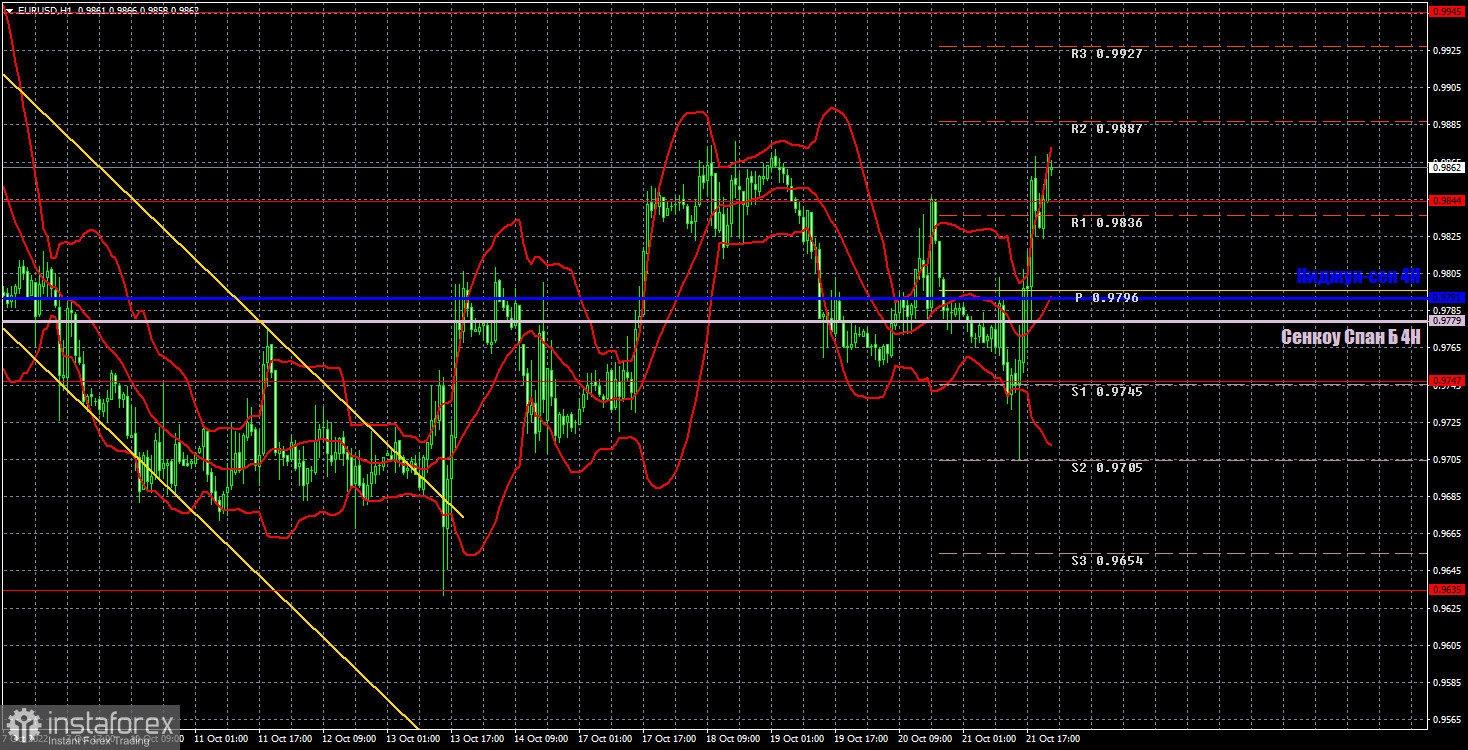
The downward trend still cannot be considered completely reversed on the hourly time frame, despite the good growth on Friday. Now the "swing" can begin and the pair can change the direction of movement every day. The lines of the Ichimoku indicator are already being ignored, which is a sign of a flat. On Monday, trading could be performed at the following levels: 0.9553, 0.9635, 0.9747, 0.9844, 0.9945, 1.0019, 1.0072, as well as Senkou Span B (0.9779) and Kijun-sen lines(0.9791). Ichimoku indicator lines can move during the day, which should be taken into account when determining trading signals. There are also additional support and resistance levels, but trading signals are not formed near them. Bounces and breakouts of the extreme levels and lines could act as signals. Don't forget about stop-loss orders, if the price covers 15 pips in the right direction. This will prevent you from losses in case of a false signal.The European Union and the United States will publish indexes of business activity in the services and manufacturing sectors. If there is no strong deviation from the predicted values, then there may not be a reaction to these data either.
What we see on the trading charts:
Price levels of support and resistance are thick red lines, near which the movement may end. They do not provide trading signals.
The Kijun-sen and Senkou Span B lines are the lines of the Ichimoku indicator, moved to the one-hour chart from the 4-hour one. They are strong lines.
Extreme levels are thin red lines from which the price bounced earlier. They provide trading signals.
Yellow lines are trend lines, trend channels, and any other technical patterns.
Indicator 1 on the COT charts reflects the net position size of each category of traders.
Indicator 2 on the COT charts reflects the net position size for the non-commercial group.
 English
 Русский
 Bahasa Indonesia
 Bahasa Malay
 ไทย
ไทย Español
 Deutsch
 Български
 Français
 Tiếng Việt
 中文
中文 বাংলা
বাংলা हिन्दी
 Čeština
 Українська
 Română

