EUR/USD 5M

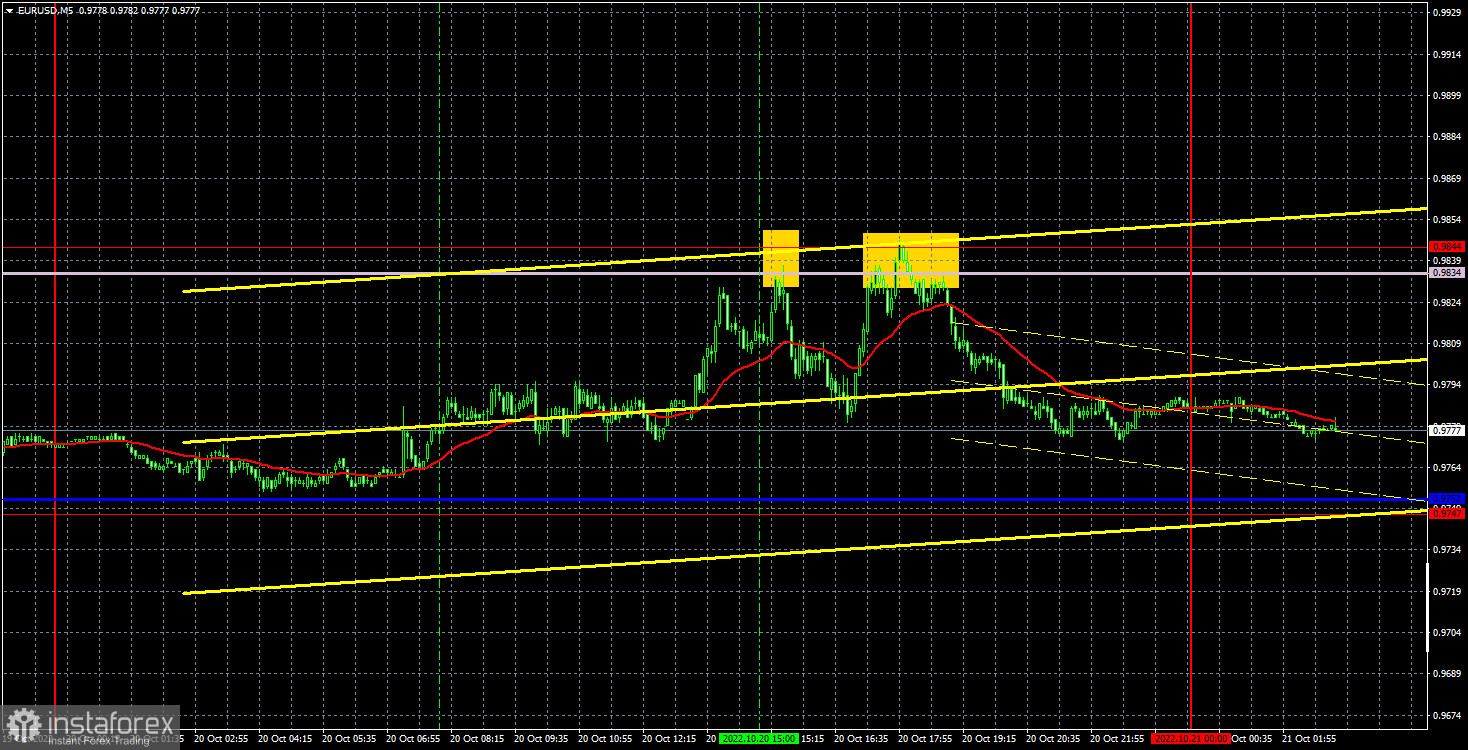
The euro/dollar pair managed to rise and fall on Thursday. The most important thing: the price was between the levels of 0.9747 and 0.9844 all day, between which the lines of the Ichimoku indicator also lie. That is, we got an almost perfect flat. Those "flights" during the day that we observed were not provoked by macroeconomic statistics. Not a single important report was published in the European Union yesterday, and there were two absolutely secondary ones in America, the values of which were not "bad" to cause the dollar's fall. We can assume that the growth of the euro and the pound was associated with the resignation of Liz Truss, but how can you say that the departure from the post of head of state of Great Britain is good for the pound? And what does the euro have to do with it? Well, the fall in the afternoon could definitely not have been provoked by anything. Thus, we believe that yesterday's movements are purely technical and somewhat random.
In regards to trading signals, everything was not very good. In fact, two signals were generated. In both cases, the price bounced from the 0.9834-0.9844 area. In the first case, 45 points to the downside, in the second - about 30. Thus, Stop Loss should have been set to breakeven for both short positions, at which both positions were closed. Of course, it was possible to close positions manually (since the target level of 0.9752 was never reached), however, the decline was not so great to do it.
COT report:

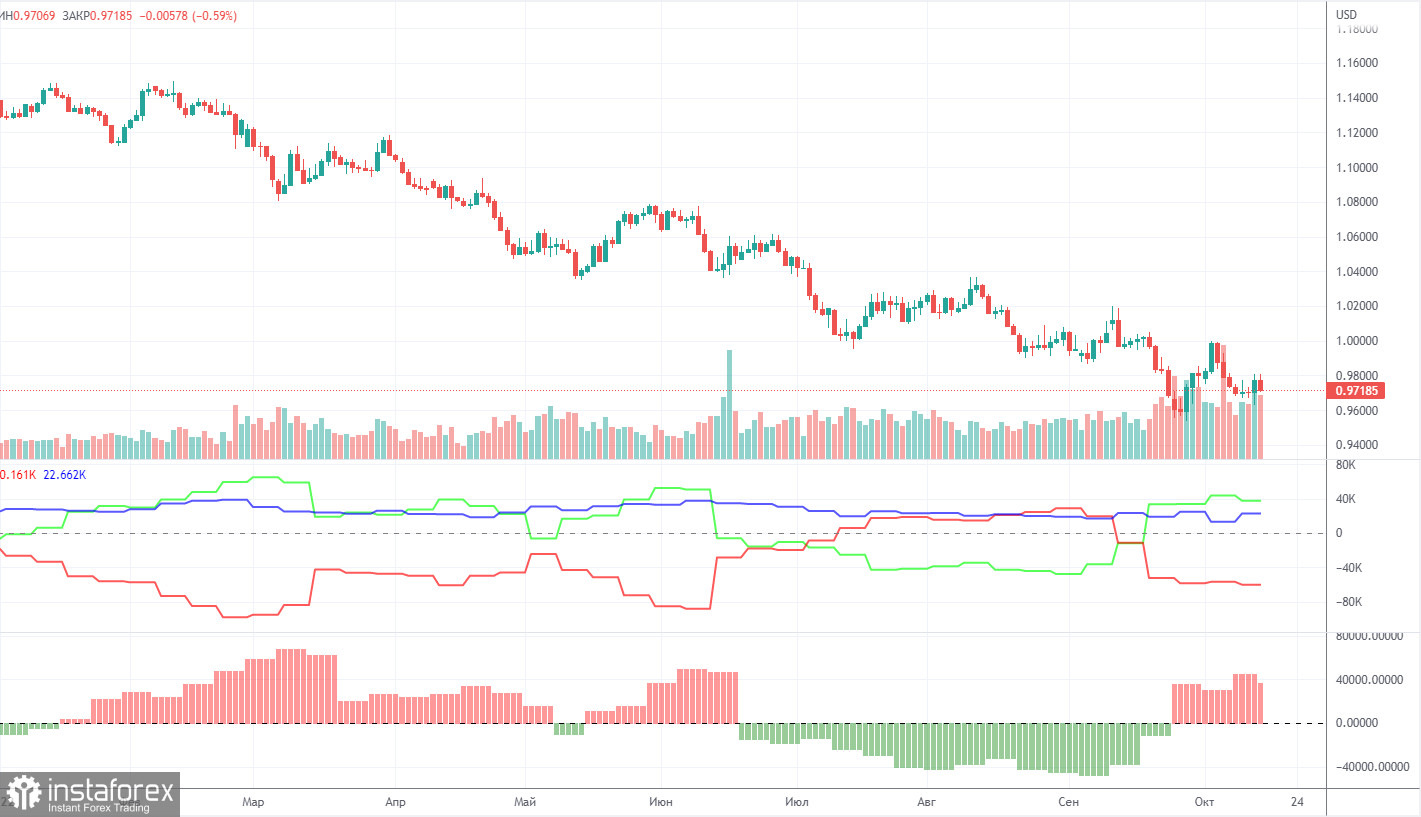
The euro Commitment of Traders (COT) reports for 2022 could be used as good examples. In the first part of the year, the reports were pointing to the bullish sentiment among professional traders. However, the euro was confidently losing value. Then, for several months, reports were reflecting bearish sentiment and the euro was also falling. Now, the net position of non-commercial traders is bullish again and the euro is still dropping. This could be explained by the high demand for the US dollar amid the difficult geopolitical situation in the world. Even if demand for the euro is rising, high demand for the greenback prevents the euro from growing. In the given period, the number of long non-commercial positions dropped by 3,200, whereas the number of short non-commercial positions jumped by 2,900. As a result, the net position declined by 6,100 contracts. However, this fact will hardly influence the market since the euro is still hovering near its multi-year lows. Now, professional traders still prefer the greenback. The number of long contracts exceeds the number of short contracts by 38,000. Thus, the net position of non-commercial traders may grow further without affecting the market. Although the total number of buy and sell positions is approximately the same, the euro continues falling. Thus, we need to wait for changes in the geopolitical and/or fundamental background to influence the foreign exchange market.
We recommend to familiarize yourself with:
Overview of the EUR/USD pair. October 21. Every day is the same! The market is consolidating around the 98th level.
Overview of the GBP/USD pair. October 21.The "pendulum" is slowing down, the political absurdity in the UK is gaining momentum.
Forecast and trading signals for GBP/USD on October 21. Detailed analysis of the movement of the pair and trading transactions.
EUR/USD 1H

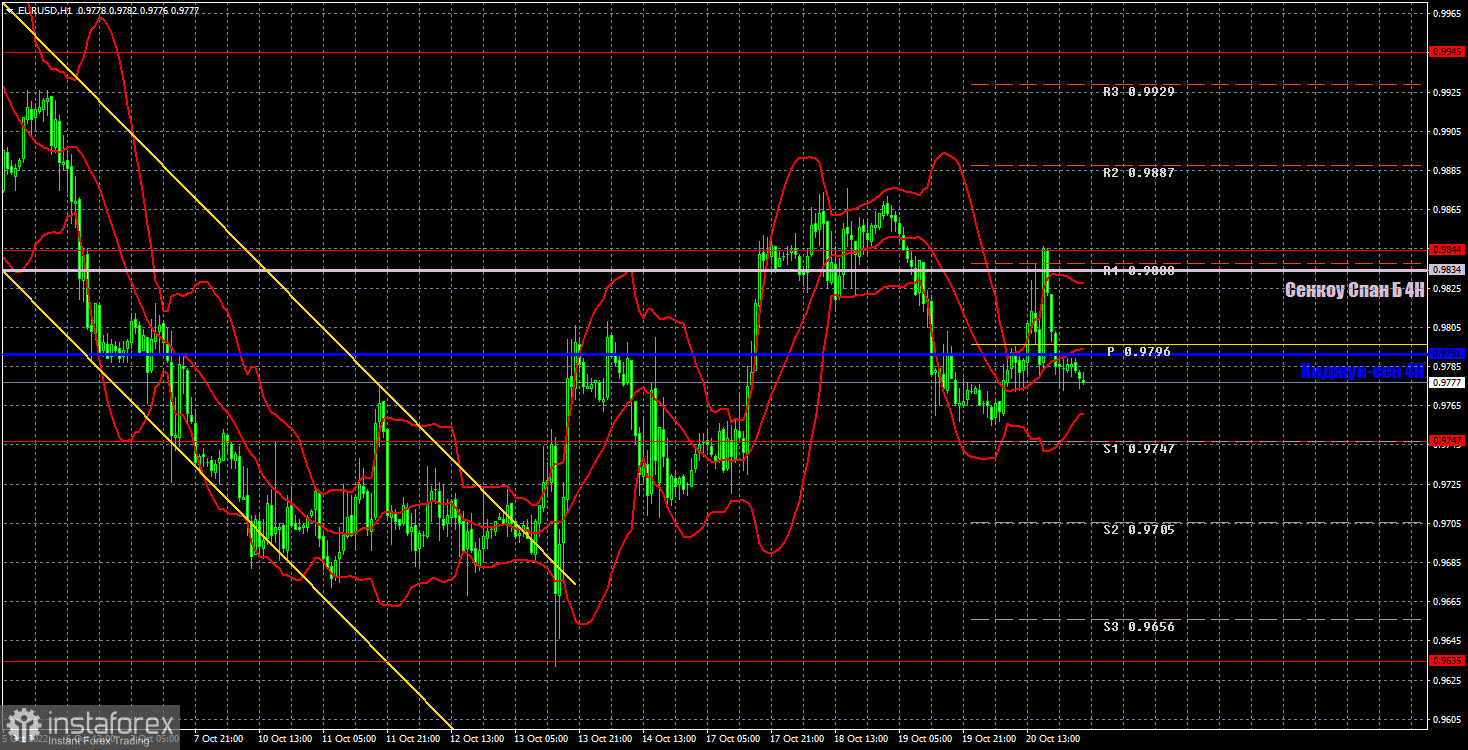
The downward trend still cannot be considered completely reversed on the one-hour chart, despite the good growth over the past week. The euro cannot consolidate above the level of 0.9844 and above the Senkou Span B line, and now a flat may also begin. All recent movements were close to 20-year lows, from which the pair cannot be "peeled off" in any way. On Friday, trading could be performed at the following levels: - 0.9553, 0.9635, 0.9747, 0.9844, 0.9945, 1.0019, 1.0072, as well as the Senkou Span B (0.9834) and Kijun-sen lines (0.9791). Ichimoku indicator lines can move during the day, which should be taken into account when determining trading signals. There are also additional support and resistance levels, but trading signals are not formed near them. Bounces and breakouts of the extreme levels and lines could act as signals. Don't forget about stop-loss orders, if the price covers 15 pips in the right direction. This will prevent you from losses in case of a false signal. No important events and reports are scheduled again in the European Union and the United States. Thus, traders will have nothing to react to during the day, and the pair may remain between the levels of 0.9747 and 0.9844.
What we see on the trading charts:
Price levels of support and resistance are thick red lines, near which the movement may end. They do not provide trading signals.
The Kijun-sen and Senkou Span B lines are the lines of the Ichimoku indicator, moved to the one-hour chart from the 4-hour one. They are strong lines.
Extreme levels are thin red lines from which the price bounced earlier. They provide trading signals.
Yellow lines are trend lines, trend channels, and any other technical patterns.
Indicator 1 on the COT charts reflects the net position size of each category of traders.
Indicator 2 on the COT charts reflects the net position size for the non-commercial group.
 English
 Русский
 Bahasa Indonesia
 Bahasa Malay
 ไทย
ไทย Español
 Deutsch
 Български
 Français
 Tiếng Việt
 中文
中文 বাংলা
বাংলা हिन्दी
 Čeština
 Українська
 Română

