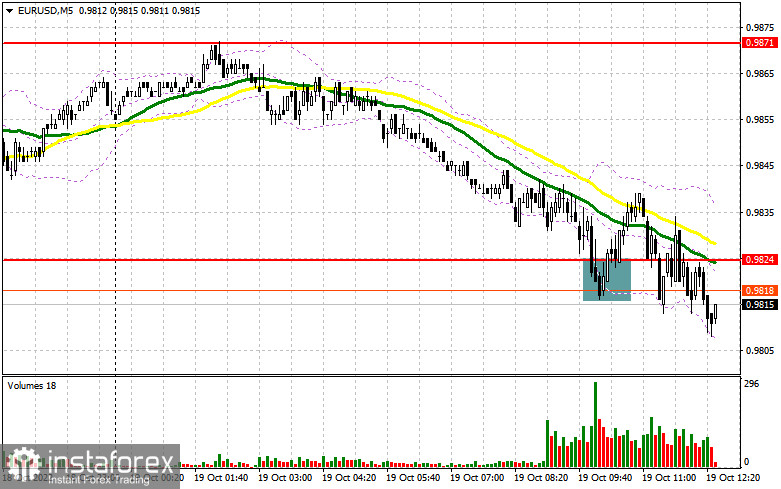
In the morning article, I turned your attention to the level of 0.9824 and recommended making decisions with this level in focus. Now, let's look at the 5-minute chart and try to figure out what actually happened. A decline and a false breakout after the release of the eurozone's inflation data, which turned out to be surprisingly better than expected, gave a buy signal. After moving up by 15 pips, the bullish momentum ebbed away. Currently, the pair trading is below 0.9824. It is likely to resume a short-term decline. In the afternoon, the technical outlook slightly changed.

When to open long positions on EUR/USD:
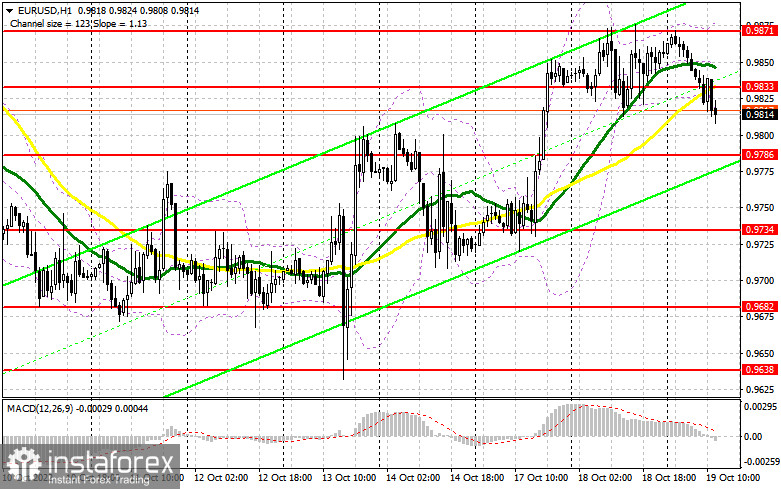
Traders are now anticipating the US Building Permits and Housing Starts reports, which could give more insight into the US economy. Notably, the real estate market was the first to show signs of a looming recession in the economy. High interest rates have already undermined home sales due to the rising cost of borrowing. Further deterioration may force investors temporarily abandon the US dollar in favor of risk assets. Fed policymaker Neil Kashkari will deliver a speech. He is likely to stress the need to stick to a hawkish stance to tame soaring inflation. Consumer prices have already reached a 40-year high. A false breakout of the nearest support 0.9786 and consolidation above this level will generate an excellent buy signal. This level is also the lower border of the uptrend channel, formed on October 13. If this scenario comes true, the pair may return to the resistance level of 0.9833, which appeared in the morning. Bulls are likely to take the upper hand if the price breaks above 0.9833. A downward test of this level will force bears to leave the market. It will give an additional buy signal with the possibility of a rise to the weekly high of 0.9871. Consolidation above this level could trigger a trend reversal, facilitating bullish sentiment. If the price climbs above 0.9871, it may advance to 0.9917 where I recommend locking in profits. If EUR/USD declines during the US session and bulls show no activity at 0.9786, the pressure on the euro will increase. A breakout of this level will undermine the bear market. Therefore, it is better to open long positions after a false breakout of 0.9734 takes place. You can buy EUR/USD immediately at a bounce from 0.9682 or 0.9638, keeping in mind an upward intraday correction of 30-35 pips.
When to open short positions on EUR/USD:
Although bears managed to defend the target level and push the pair lower, a further decline is rather questionable. Currently, the majority of analysts expect a recovery of the euro. On top of that, traders were unwilling to open short positions due to strong US data revealed last week. This is why they are now cautious. It is recommended to sell after a false breakout of the resistance level of 0.9833. If so, the price may return to 0.9786 where sellers will again face strong resistance levels. Only a breakout and an upward test of this level amid hawkish remarks from Fed officials and the US stable real estate market will give a sell signal with the prospect of a fall to 0.9734. It will significantly weaken bullish sentiment. A more distant target will be the 0.9682 level where I recommend locking in profits. If EUR/USD rises during the US session and bears show no energy at 0.9833, demand for the pair will increase. A strong upward correction may follow. In this case, it is better to postpone short positions until a false breakout of 0.9871 takes place. You can sell EUR/USD immediately at a bounce from a high of 0.9917 or 0.9948, keeping in mind a downward intraday correction of 30-35 pips.

Commitments of Traders:
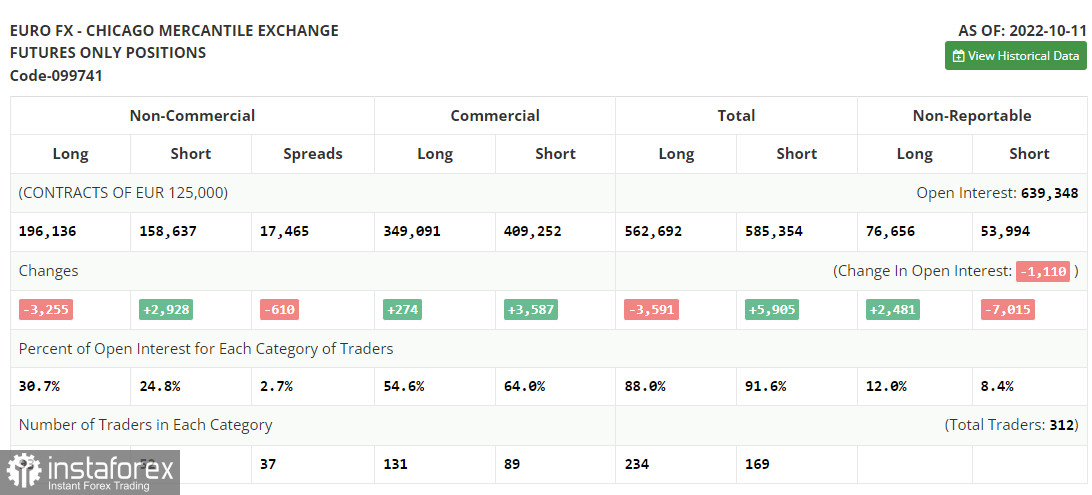
The COT report for October 11 logged a sharp fall in long positions and a rise in short ones. It seems that traders were bracing for the release of the US inflation and retail sales reports. It appears that taming inflation has become a real challenge for the Fed. As the September report shows, inflation slowed just by 0.1% from the previous reading. This is why the US regulator is likely to remain hawkish or become even more aggressive. Notably, it has been a while since the last mass sell-off of the euro below the parity level. In fact, such factors as geopolitical tensions and the tightening cycle of the Federal Reserve are not enough to push the pair lower. Therefore, it is better to open long positions on the euro in the medium term. The COT report revealed that the number of long non-commercial positions dropped by 3,255 to 196,136, while the number of short non-commercial positions grew by 2,928 to 158,637. In a week, the total non-commercial net position remained positive and amounted to 37,499 versus 43,682. Investors use this as an opportunity to buy the cheaper euro below parity and accumulate long positions, hoping for the end of the crisis and the pair's recovery in the long run. The weekly closing price decreased to 0.9757 from 1.0053.

Signals of technical indicators
Moving averages
EUR/USD is trading near 30- and 50-period moving averages. It means that the bulls and bears are tussling.
Remark. The author is analyzing the period and prices of moving averages on the 1-hour chart. So, it differs from the common definition of classic daily moving averages on the daily chart.
Bollinger Bands
If EUR/USD moves up, the indicators' upper border at 0.9870 will act as resistance.
Definitions of technical indicators
- Moving average recognizes an ongoing trend through leveling out volatility and market noise. A 50-period moving average is plotted in yellow on the chart.
- Moving average identifies an ongoing trend through leveling out volatility and market noise. A 30-period moving average is displayed as the green line.
- MACD indicator represents a relationship between two moving averages that is a ratio of Moving Average Convergence/Divergence. The MACD is calculated by subtracting the 26-period Exponential Moving Average (EMA) from the 12-period EMA. A 9-day EMA of the MACD called the "signal line".
- Bollinger Bands is a momentum indicator. The upper and lower bands are typically 2 standard deviations +/- from a 20-day simple moving average.
- Non-commercial traders - speculators such as retail traders, hedge funds, and large institutions who use the futures market for speculative purposes and meet certain requirements.
- Non-commercial long positions represent the total long open position of non-commercial traders.
- Non-commercial short positions represent the total short open position of non-commercial traders.
- The overall non-commercial net position balance is the difference between the short and long positions of non-commercial traders.
 English
 Русский
 Bahasa Indonesia
 Bahasa Malay
 ไทย
ไทย Español
 Deutsch
 Български
 Français
 Tiếng Việt
 中文
中文 বাংলা
বাংলা हिन्दी
 Čeština
 Українська
 Română

