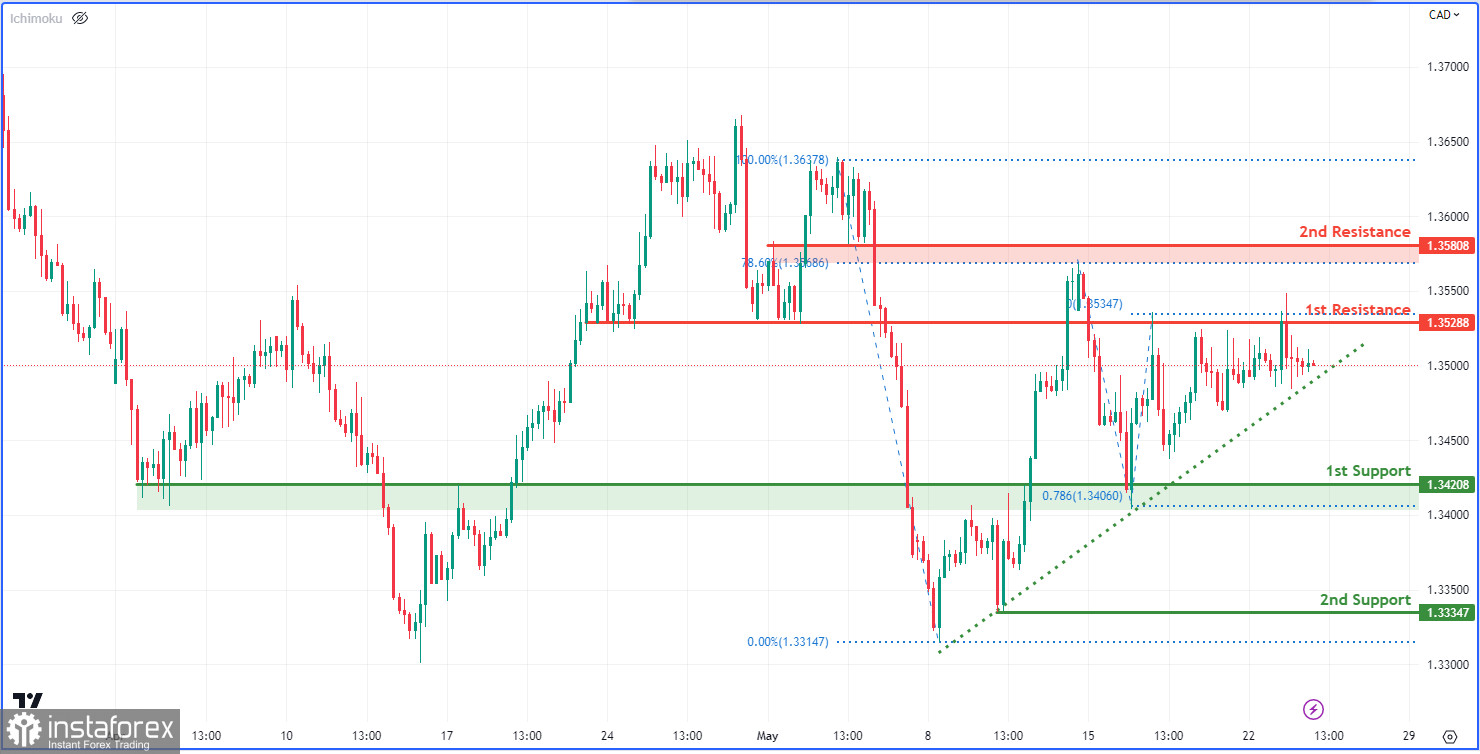
Currently, the USD/CAD chart is displaying a bullish trend, hinting at possible further rises in price. In the near term, there's a potential for the bullish trend to persist towards the initial resistance level of 1.3529. This level is characterized as an overlap resistance, signifying its potential role as a limit to price increases.
In addition, a second resistance level is recognized at 1.3581, marked as an overlap resistance and aligning with the 78.60% Fibonacci retracement. This highlights the likelihood of encountering resistance should the price rise further.
On the downside, the first support level at 1.3421, acting as an overlap support, could provide a base for price and aid any possible retracements. Moreover, another support level at 1.3335, also designated as an overlap support, adds to the prospects for a price floor in case of a downturn.

 English
 Русский
 Bahasa Indonesia
 Bahasa Malay
 ไทย
ไทย Español
 Deutsch
 Български
 Français
 Tiếng Việt
 中文
中文 বাংলা
বাংলা हिन्दी
 Čeština
 Українська
 Română

