Details of the economic calendar for October 14
Retail sales in the United States slowed down from 9.1% to 8.41%. Consumer activity is declining in the country, which is a negative factor for the economy, hinting at a gradual slide into recession.
The main financial topics discussed in the media:
British Prime Minister Liz Truss fired Finance Minister Kwasi Kwarteng.
"You have asked me to stand aside as your chancellor. I have accepted," Kwarteng wrote in a letter to the Prime Minister, which he published on his Twitter account.
Ex-Foreign Minister Jeremy Hunt has been appointed as the new British Chancellor of the Exchequer.
The reshuffling of the prime minister's inner circle makes her position more and more precarious. Already on Monday, Truss's associates in the party will discuss her possible resignation.
Analysis of trading charts from October 14
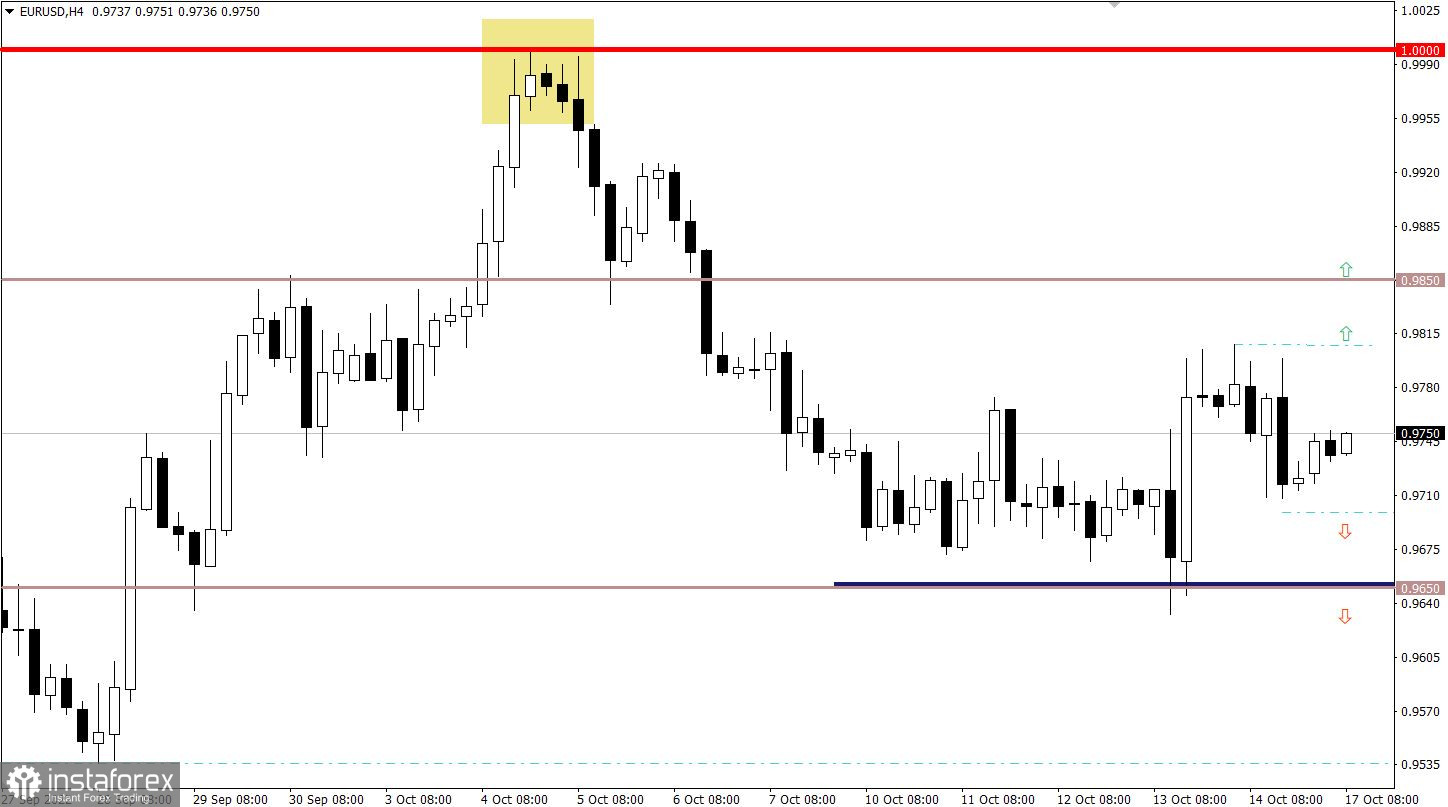
The EURUSD currency pair, after a short upward rally, again returned to the limit of acceptable deviation from the level of 0.9700. This price move indicates a characteristic stage of uncertainty, leading to variable turbulence.
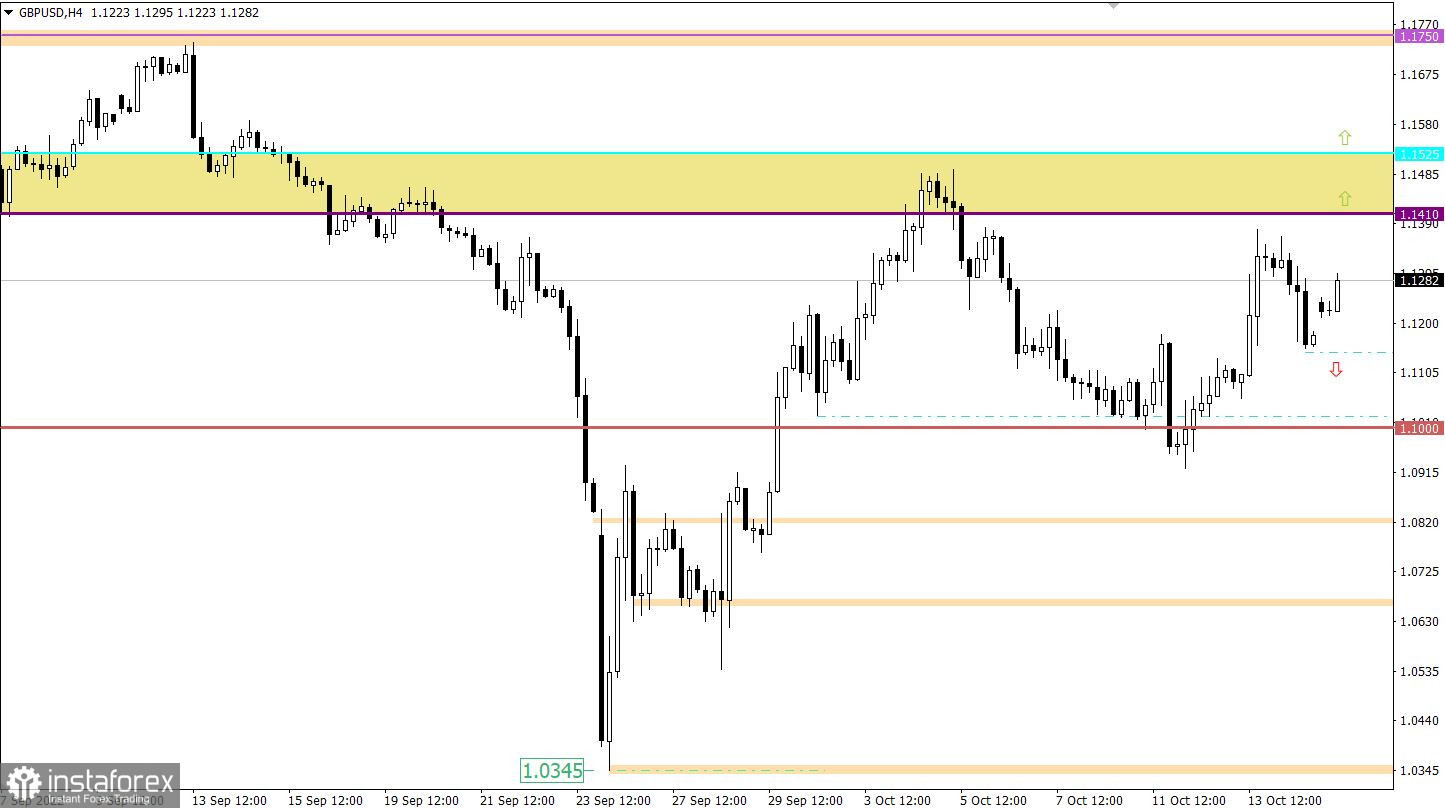
The GBPUSD currency pair during the upward impulse reached the lower border of the resistance area 1.1410/1.1525. As a result, there was a reduction in the volume of long positions on the market, which first led to a slowdown and then to a rebound in prices.

Economic calendar for October 17
Monday is usually accompanied by an empty macroeconomic calendar. Important statistics in Europe, the United Kingdom, and the United States are not expected.
In this regard, investors and traders will be guided by the incoming information and news flow.
Trading plan for EUR/USD on October 17
Holding the price below the level of 0.9700 may well lead to a movement towards the variable pivot point 0.9650. Under this scenario, market participants will return to the trajectory of the previous fluctuation within 0.9650/0.9750.
The upward scenario will become relevant if the quote rises above the local high of the past week. In this case, it is possible to strengthen the euro at least to the level of 0.9850.

Trading plan for GBP/USD on October 17
A new trading week was opened with a price gap of about 50 points on an upward trajectory. In order for the downward cycle to continue forming, it is first necessary to close the gap after keeping the price below 1.1150. In this case, the probability of a move to the level of 1.1000 is high.
The upward scenario will be considered by traders if the price returns to the resistance area of 1.1410/1.1525.

What is shown in the trading charts?
A candlestick chart view is graphical rectangles of white and black light, with sticks on top and bottom. When analyzing each candle in detail, you will see its characteristics of a relative period: the opening price, closing price, and maximum and minimum prices.
Horizontal levels are price coordinates, relative to which a stop or a price reversal may occur. These levels are called support and resistance in the market.
Circles and rectangles are highlighted examples where the price of the story unfolded. This color selection indicates horizontal lines that may put pressure on the quote in the future.
The up/down arrows are the reference points of the possible price direction in the future.
 English
 Русский
 Bahasa Indonesia
 Bahasa Malay
 ไทย
ไทย Español
 Deutsch
 Български
 Français
 Tiếng Việt
 中文
中文 বাংলা
বাংলা हिन्दी
 Čeština
 Українська
 Română

