EUR/USD 5M

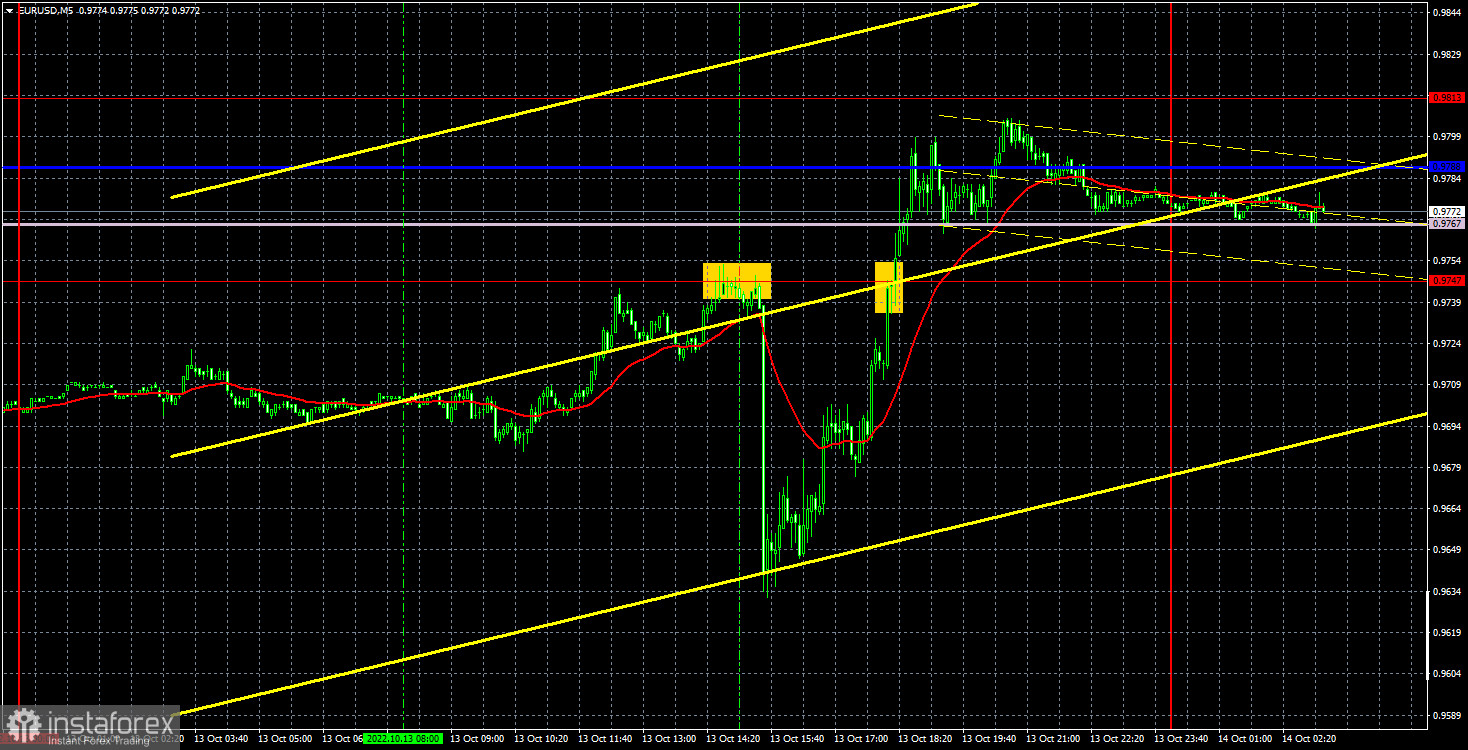
Yesterday, the euro/dollar pair tried to set a volatility record. It passed almost 170 points from the low to the high of the day and all 170 points after the US inflation report was published. The most interesting thing is that the report itself fully corresponded to the forecast value - 8.1-8.2%. However, for the market, the news that inflation in the United States has practically stopped slowing down (the decrease was only 0.1%) had the effect of a nuclear bomb. At first, the dollar grew (which is quite logical), because the dollar fell (which is completely illogical). Thus, we saw multidirectional movements that can only be tied to the inflation report. Another interesting fact is that virtually any September inflation reading would have had no effect on the Federal Reserve's monetary policy plans. There was virtually no chance for inflation to rise. Falling hard - there were chances, but the overall fall would still not be so strong that the Fed abandoned plans to raise the rate by 0.75% again. Thus, we would not be surprised if the market reaction to this report was weak. But it turned out differently.
There were several trading signals on Thursday, but each of them was associated with high risks. The first and most adequate sell signal was formed half an hour before the release of the report, when the price rebounded from the level of 0.9747. This signal could be worked out by placing Stop Loss above 0.9747. Subsequently, the pair went down more than 100 points, but the nearest target level was very far away, so traders could close the position with excellent profit just 5 minutes after the report. The buy signal near the level of 0.9747 should not have been worked out, since it was formed late in time.
COT report:

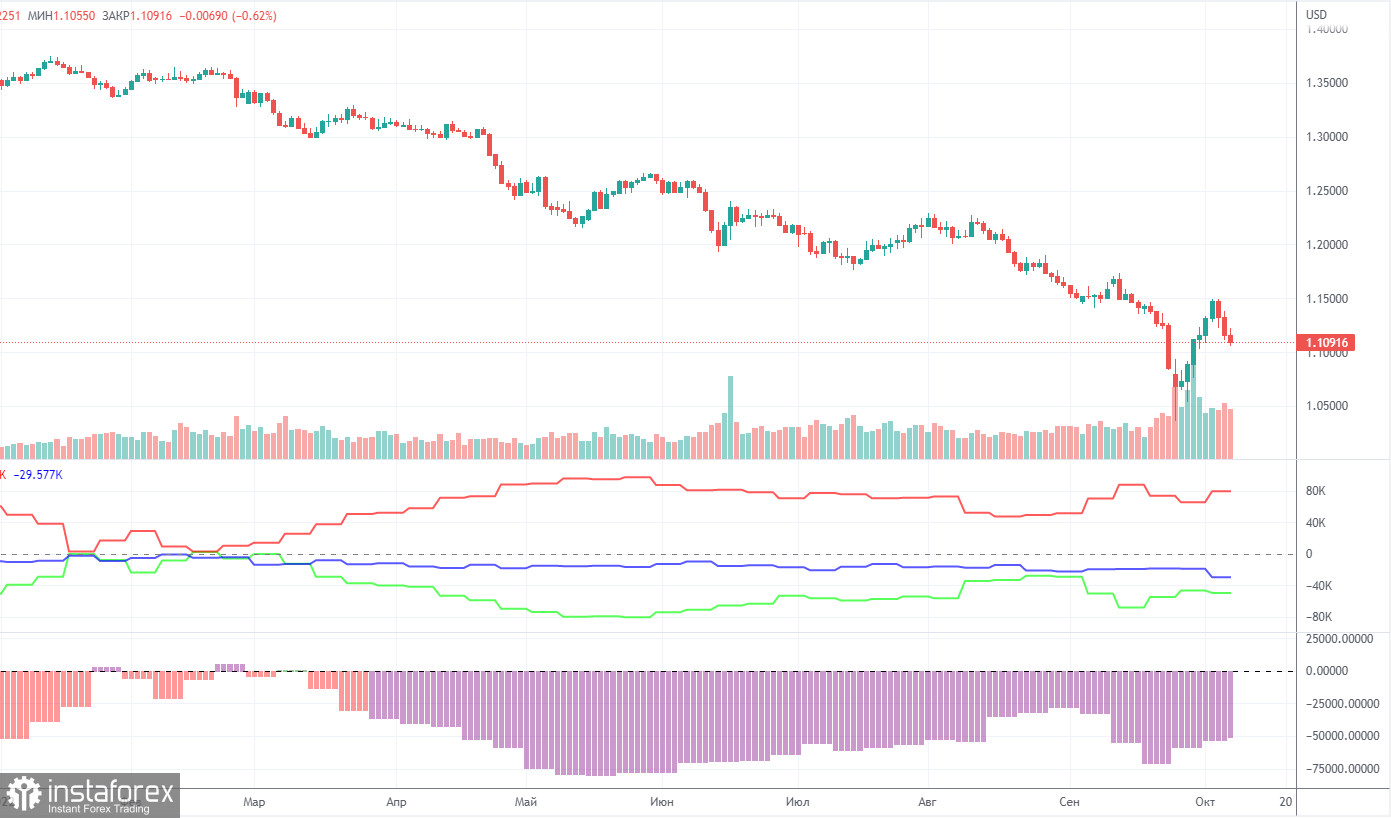
The Commitment of Traders (COT) reports in 2022 can be entered into a textbook as an example. For half of the year, they showed a blatant bullish mood of commercial players, but at the same time, the euro fell steadily. Then for several months they showed a bearish mood, and the euro also fell steadily. Now the net position of non-commercial traders is bullish again, and the euro continues to fall. This happens, as we have already said, due to the fact that the demand for the US dollar remains very high amid a difficult geopolitical situation in the world. Therefore, even if the demand for the euro is rising, the high demand for the dollar does not allow the euro itself to grow. During the reporting week, the number of long positions for the non-commercial group decreased by 9,300, and the number of shorts by 19,200. Accordingly, the net position grew by about 9,900 contracts. This fact is not of particular importance, since the euro still remains "at the bottom". At this time, commercial traders still prefer the euro to the dollar. The number of longs is higher than the number of shorts for non-commercial traders by 45,000, but the euro cannot derive any dividends from this. Thus, the net position of the non-commercial group can continue to grow further, this does not change anything. Even if you pay attention to the total number of longs and shorts, their values are approximately the same, but the euro is still falling. Thus, it is necessary to wait for changes in the geopolitical and/or fundamental background in order for something to change in the currency market.
We recommend to familiarize yourself with:
Overview of the EUR/USD pair. October 14. "That's all folks". US inflation fell to 8.2%.
Overview of the GBP/USD pair. October 14. The Bank of England is preparing for a new powerful rate hike. The pound rushed right off the bat without waiting for US inflation data.
Forecast and trading signals for GBP/USD on October 14. Detailed analysis of the movement of the pair and trading transactions.
EUR/USD 1H

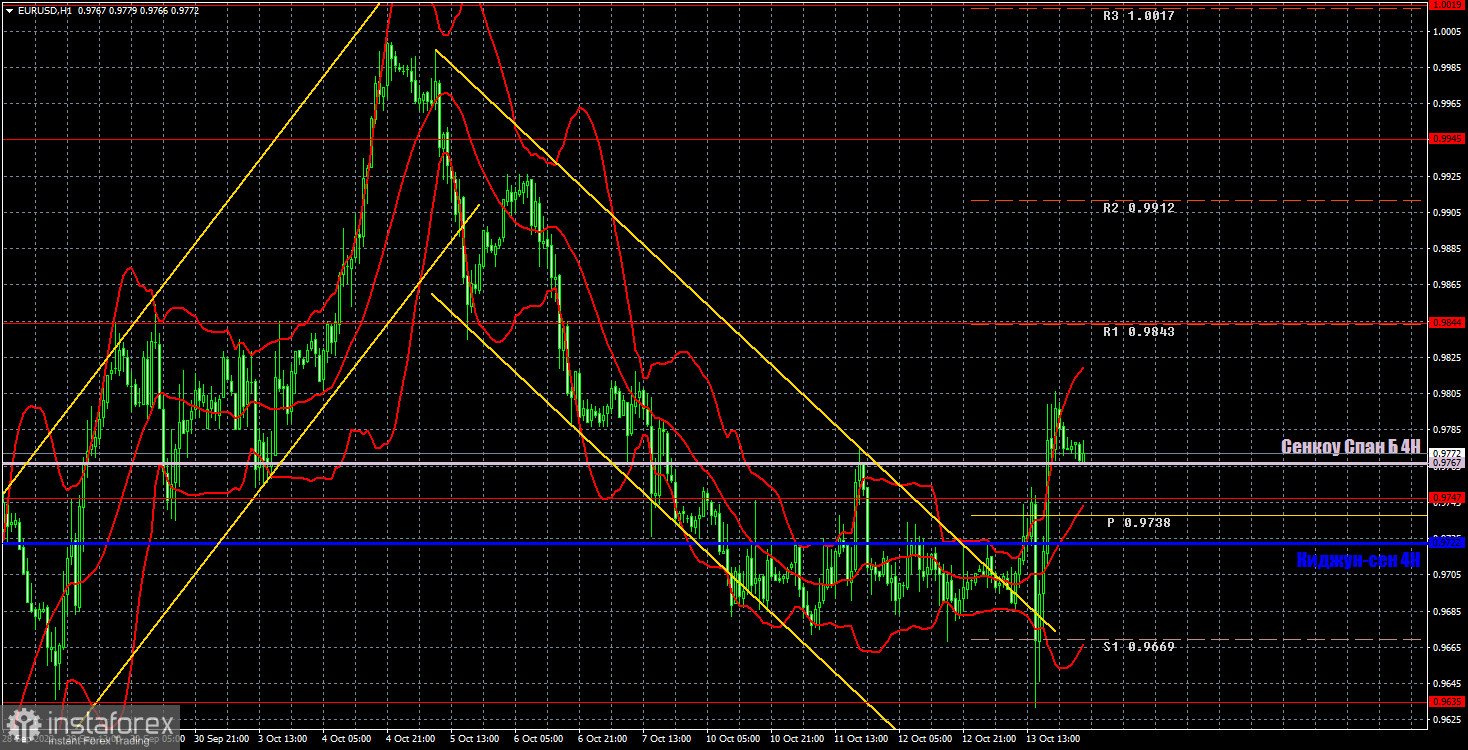
The downward trend still cannot be considered reversed on the hourly timeframe, despite a solid growth yesterday. The price has not really managed to gain a foothold above the Senkou Span B line yet, and the final fall of the dollar after the inflation report cannot be called logical, so the pair may fall back to its original positions today. On Friday, we highlight the following levels for trading - 0.9553, 0.9635, 0.9747, 0.9844, 0.9945, 1.0019, 1.0072, as well as Senkou Span B (0.9767) and Kijun-sen lines (0.9722). Ichimoku indicator lines can move during the day, which should be taken into account when determining trading signals. There are also secondary support and resistance levels, but no signals are formed near them. Signals can be "rebounds" and "overcoming" extreme levels and lines. Do not forget about placing a Stop Loss order at breakeven if the price has gone in the right direction for 15 points. This will protect you against possible losses if the signal turns out to be false. There will be no important events and reports in the European Union. We only have secondary statistics in America. The market, rather, will continue to work out the US inflation report. Strong movement can persist at night. The Europeans did not have the opportunity to work out this report, so a good movement can also be observed in the morning.
Explanations for the chart:
Support and Resistance Levels are the levels that serve as targets when buying or selling the pair. You can place Take Profit near these levels.
Kijun-sen and Senkou Span B lines are lines of the Ichimoku indicator transferred to the hourly timeframe from the 4-hour one.
Support and resistance areas are areas from which the price has repeatedly rebounded off.
Yellow lines are trend lines, trend channels and any other technical patterns.
Indicator 1 on the COT charts is the size of the net position of each category of traders.
Indicator 2 on the COT charts is the size of the net position for the non-commercial group.
 English
 Русский
 Bahasa Indonesia
 Bahasa Malay
 ไทย
ไทย Español
 Deutsch
 Български
 Français
 Tiếng Việt
 中文
中文 বাংলা
বাংলা हिन्दी
 Čeština
 Українська
 Română

