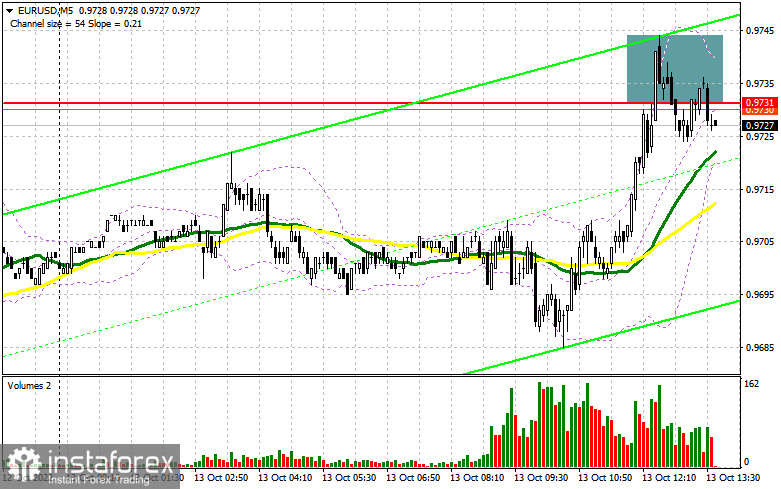
In the morning article, I turned your attention to the level of 0.9731and recommended making decisions with this level in focus. Now, let's look at the 5-minute chart and try to figure out what actually happened. After a rise to 0.9731, it once again failed to consolidate at this level, which led to a sell signal. At the time of writing the article, it declined by about 15 points. For the afternoon, the technical outlook has not changed.

Conditions for opening long positions on EUR/USD:
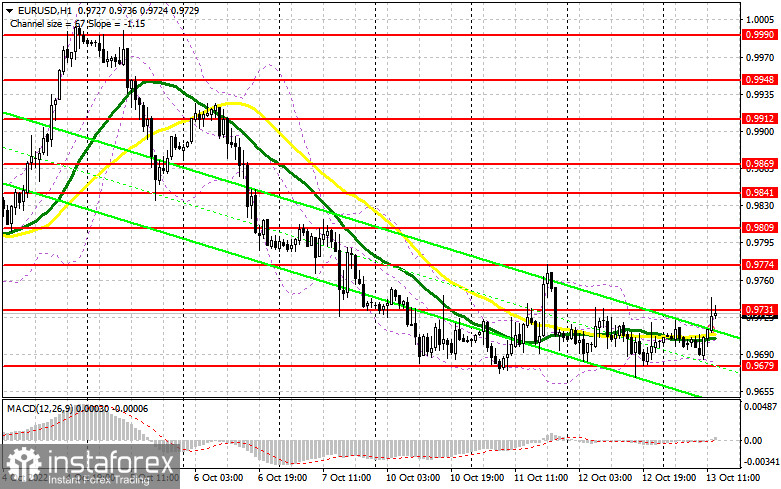
Traders are now anticipating the US CPI report. If the reading tops analysts' expectations, the US dollar is sure to jump. In this case, the euro/dollar pair is likely to drift lower. The bulls will hardly defend the support level of 0.9679. If inflation slows down in September, there could be a breakout of 0.9731 and an upward movement. EUR/USD could rebound again to the parity level. Only a false breakout of 0.9679, similar to the one that occurred yesterday, may push the pair up to 0.9731. Consolidation above this level and a downward test will undermine bears' attempt to control the market. It will generate a bull signal with the prospect of a rise to 0.9774. A breakout of this level will also open the path to 0.9809. It will weaken the bearish sentiment considerably. If EUR/USD decreases after the inflation report, a breakout of 0.9679 will quickly push the euro down to the next support level of 0.9638. It is better to open long positions at this level only if a false breakout takes place. You can buy EUR/USD immediately at a bounce from 0.9592 or 0.9540, keeping in mind an upward intraday correction of 30-35 pips.
Conditions for opening short positions on EUR/USD:
Sellers managed to defend the resistance level of 0.9731. As long as the pair is trading below this level, the pair is likely to move to the lower border of the sideways channel Bulls may once again try to push the pair above 0.9731 after the release of CPI data. So, I would not mainly focus on this level. Only a false breakout of this level could give a new sell signal with the prospect of a return to 0.9679. A drop below this level will increase pressure on the euro. An upward test will provide a sell signal, forcing bulls to close Stop Loss orders. The pair may take a nosedive to a low of 0.9638. It is also recommended to open short positions after the breakout of 0.9679 occurs. Yet, one should more or less realize what to expect from the inflation report. A more distant target will be the support level of 0.9592 where I recommend locking in profits. If EUR/USD rises during the US session and bears show no energy at 0.9731, buyers are likely to take the upper hand. An upward correction to a high of 0.9774 may take place. If so, it is better to open short positions only if a false breakout occurs. You can sell EUR/USD immediately at a bounce from 0.9809 or 0.9841, keeping in mind a downward intraday correction of 30-35 pips.

COT report
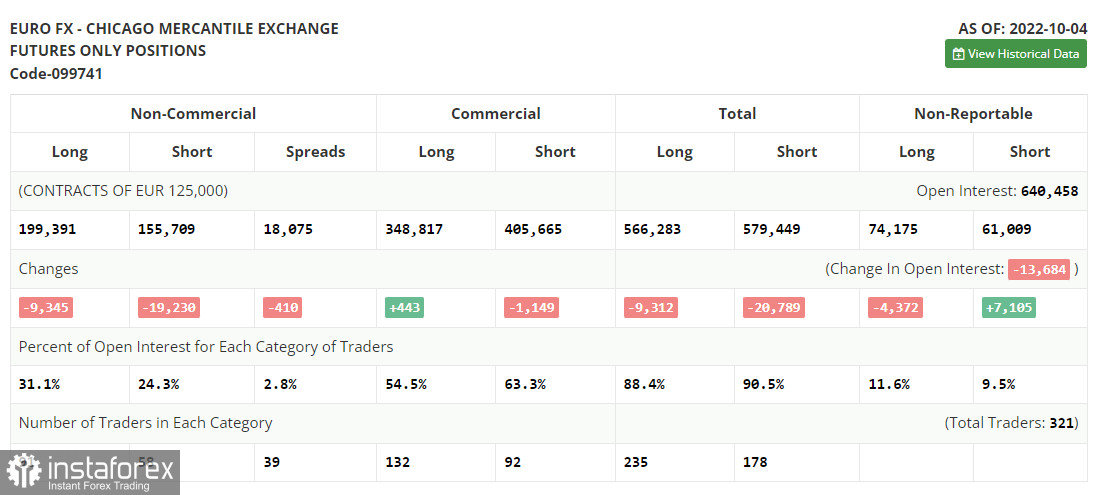
The COT report (Commitment of Traders) for October 4 logged a sharp drop in both short and long positions. Many large investors prefer a wait-and-see approach now, especially given mounting geopolitical tensions. It is facilitating demand for the US dollar as a safe-haven currency. Analysts reckon that the euro may soon plunge to new lows versus the greenback amid the latest US Nonfarm Payrolls report and the inflation figures for September. In the near future, risky assets may face strong bearish pressure, dropping to yearly lows. The COT report revealed that the number of long non-commercial positions decreased by 9,345 to 199,391, while the number of short non-commercial positions slid by 19,230 to 155,709. At the end of the week, the total non-commercial net position remained positive and amounted to 43,682 against 33,797. It appears investors are taking advantage of the moment, buying the euro below the parity level. They are also increasing long positions, betting on the improvement in the energy crisis and a long-term rally of the euro. The weekly closing price advanced to 1.0053 against 0.9657.

Signals of technical indicators
Moving averages
EUR/USD is trading near 30- and 50-period moving averages. It indicates market uncertainty which is likely to persist until the release of CPI data.
Remark. The author is analyzing the period and prices of moving averages on the 1-hour chart. So, it differs from the common definition of classic daily moving averages on the daily chart.
Bollinger Bands
If EUR/USD moves down, the indicator's lower border at 0.9679 will act as support.
Definitions of technical indicators
- Moving average recognizes an ongoing trend through leveling out volatility and market noise. A 50-period moving average is plotted in yellow on the chart.
- Moving average identifies an ongoing trend through leveling out volatility and market noise. A 30-period moving average is displayed as the green line.
- MACD indicator represents a relationship between two moving averages that is a ratio of Moving Average Convergence/Divergence. The MACD is calculated by subtracting the 26-period Exponential Moving Average (EMA) from the 12-period EMA. A 9-day EMA of the MACD called the "signal line".
- Bollinger Bands is a momentum indicator. The upper and lower bands are typically 2 standard deviations +/- from a 20-day simple moving average.
- Non-commercial traders - speculators such as retail traders, hedge funds, and large institutions who use the futures market for speculative purposes and meet certain requirements.
- Non-commercial long positions represent the total long open position of non-commercial traders.
- Non-commercial short positions represent the total short open position of non-commercial traders.
- The overall non-commercial net position balance is the difference between the short and long positions of non-commercial traders.
 English
 Русский
 Bahasa Indonesia
 Bahasa Malay
 ไทย
ไทย Español
 Deutsch
 Български
 Français
 Tiếng Việt
 中文
中文 বাংলা
বাংলা हिन्दी
 Čeština
 Українська
 Română

