Technical outlook:
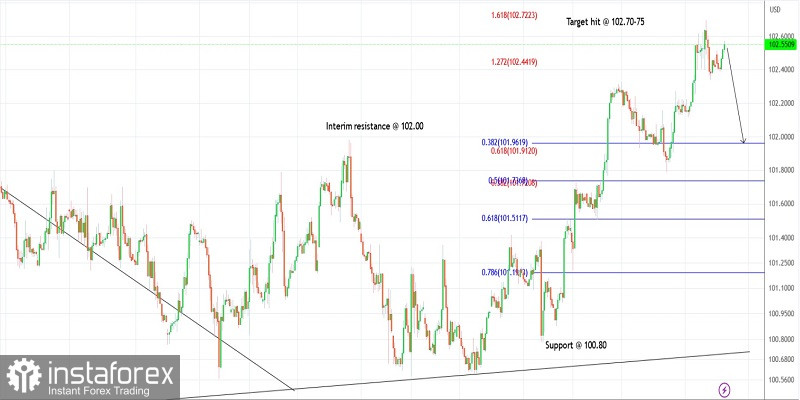
The US dollar index has rallied through 102.70 hitting the Fibonacci extensions projected earlier on Monday. The rally on Wednesday now looks complete and the index should produce a corrective drop towards 102.00 and up to 101.50 in the near term. The instrument is seen to be trading close to 102.50 at this point in writing as the bears prepare to drag prices lower from here.
The US dollar index has now carved a meaningful upswing between 100.60 and 102.70 as seen on the hourly chart. Prices should now retrace the above rally and the index could drop to the Fibonacci 0.618 retracement, around the 101.40-50 zone. The bulls will be inclined to come back in control thereafter and push the price through 105.00 going forward.
The US dollar index is currently carving a larger-degree corrective wave, which began from the 100.34 lows. The entire corrective phase is expected to complete above 105.50 and up to 109.00 in the next several weeks. Only a consistent break below 100.34 will change the bullish structure and bring back the bears into play.
Trading idea:
A potential rally to continue towards 105.00 after a corrective drop.
Good luck!
 English
 Русский
 Bahasa Indonesia
 Bahasa Malay
 ไทย
ไทย Español
 Deutsch
 Български
 Français
 Tiếng Việt
 中文
中文 বাংলা
বাংলা हिन्दी
 Čeština
 Українська
 Română

