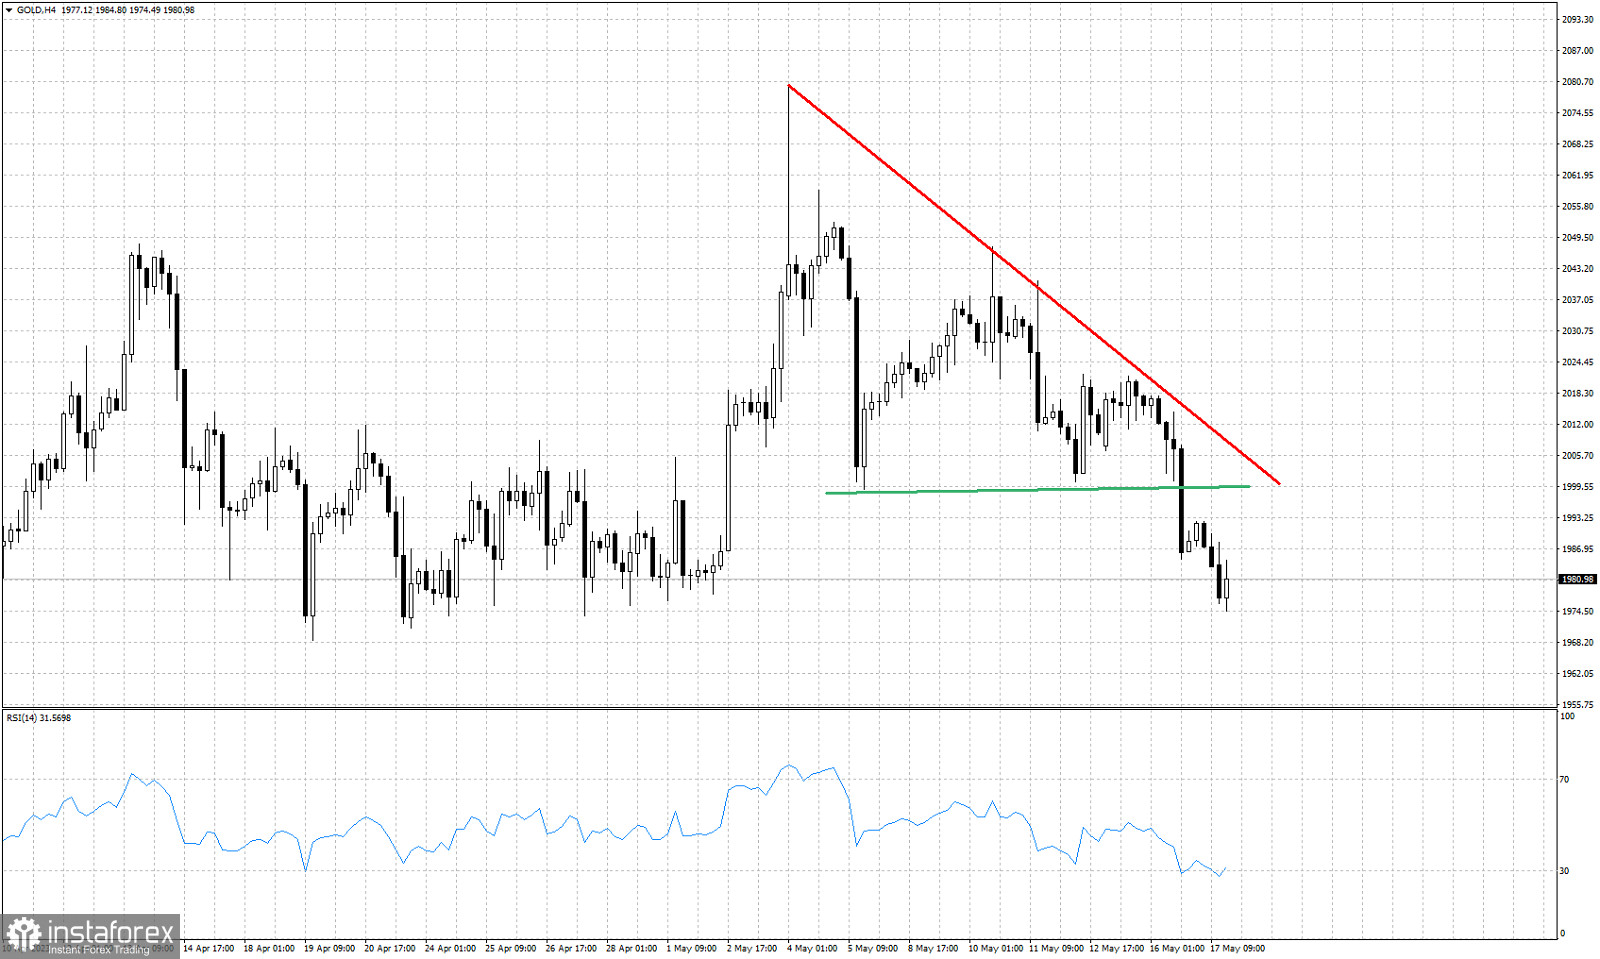
Red line -resistance
Green line- support (broken)
Gold price is trading around $1,980. In our previous analysis we noted the triangle pattern Gold was in and that a break below the green support trend line would lead to a decline at least towards $1,970-77 area. Today's low was at $1,974. Short-term trend is bearish as price has started forming lower lows and lower highs. Gold price is now challenging the $1,970 lows and a break below it will open the way for a move lower towards $1,950 at least. Resistance remains key at $2,014. Bulls need to recapture this price level in order to regain control of the near term trend.
 English
 Русский
 Bahasa Indonesia
 Bahasa Malay
 ไทย
ไทย Español
 Deutsch
 Български
 Français
 Tiếng Việt
 中文
中文 বাংলা
বাংলা हिन्दी
 Čeština
 Українська
 Română

