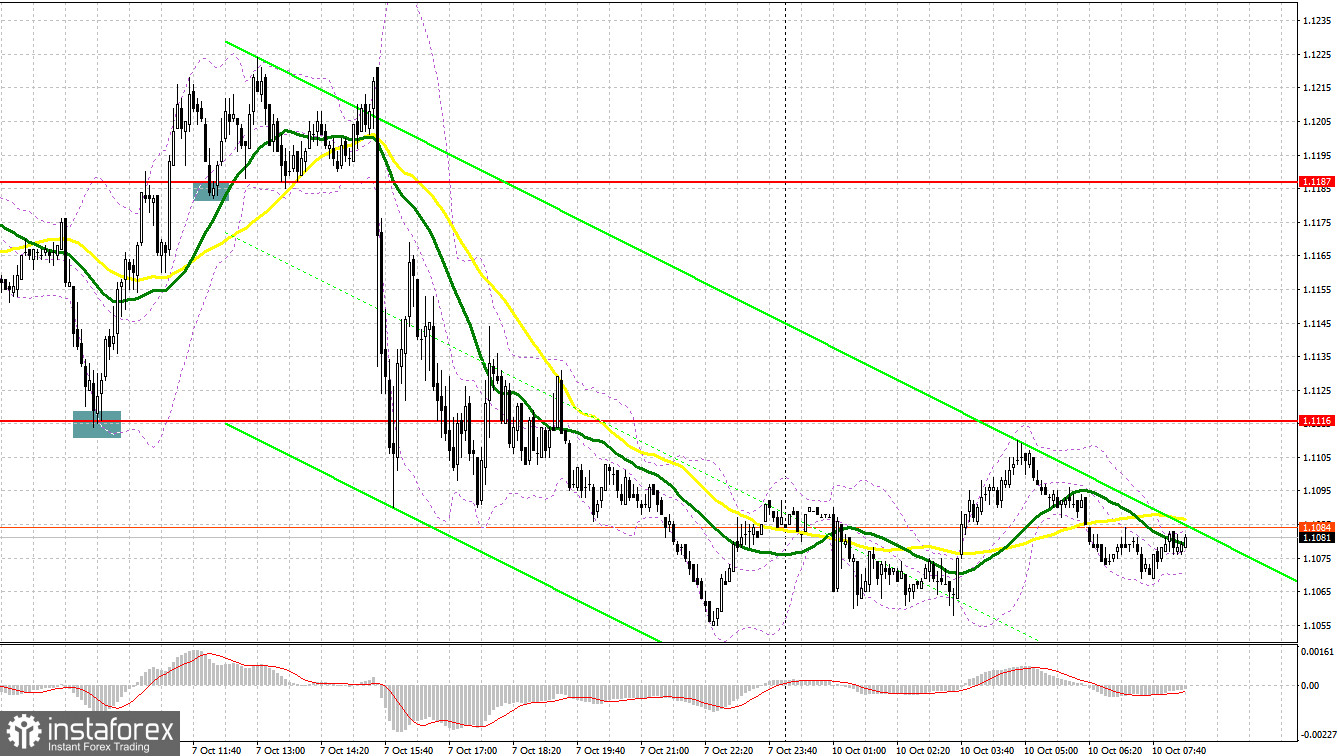
Several good entry signals were formed on Friday. Let's analyze the 5-minute chart. In my morning review, I outlined two levels of 1.1116 and 1.1187 and recommended entering the market from there. In the course of its rapid fall in the first half of the day, the pound made a false breakout at 1.1116 which formed a great buy signal. As a result, the pair recovered back to 1.1187, thus generating around 70 pips in profit. A failure to settle above 1.1187 created a sell signal and a decline of 30 pips. After that, the pound was back to the bull market. A breakout and a retest of 1.1187 served as a signal to buy the pair which generated a 30-pip profit. However, the pound couldn't develop further growth as the macroeconomic data from the US had limited its upside potential. No more signals were formed in the second half of the day as volatility was extremely high.

For long positions on GBP/USD:
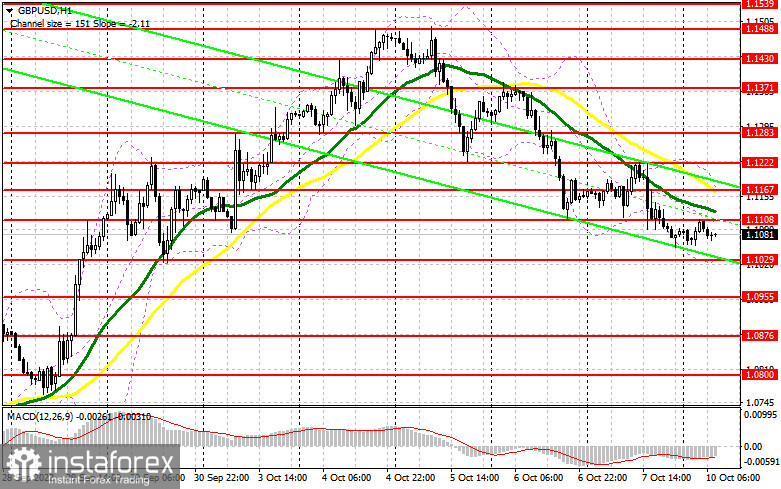
Strong US jobs growth pressured the pound although the decline was rather moderate. This indicates that large institutional buyers are still in play. Today, the trajectory of the pair will largely depend on how traders will act at the 1.1029 level. If bulls give up this level, the pound/dollar pair will come under pressure again. As no important data releases are expected today, bulls will have no supporting factors. Apparently, bears want to extend the correction encouraged by Friday's positive reports. They can break through the nearest support of 1.1029 at any moment. Only its false breakout will create a buy signal with a possible return to 1.1107 which acts as interim support formed at the end of the Asian session. A breakout and a downward test of this range may trigger stop-loss orders, thus creating a new buy signal with a higher target at 1.1167. This is where the moving averages that support the bear market are located. The high of 1.1222 will serve as the furthest target for the bulls. Yet, its testing will not cancel the bear market. If bulls fail to defend the level of 1.1029, the pair will continue to slide to and may even retest the low of 1.0955. It is recommended to buy the pair at this point only on a false breakout. Going long on GBP/USD right after a rebound is possible from the area of 1.0876 or even lower from 1.0800, bearing in mind an intraday correction of 30-35 pips.
For short positions on GBP/USD:
Sellers are still in control of the market, especially after a strong jobs report from the US which confirmed the stability of its economy even despite the aggressive Fed's policy. The main task for bears today will be to break through 1.1029 and defend 1.1108. The best moment to sell the pair would be a false breakout of 1.1108 formed during the Asian session. Bears should do their best to stay in control of this level. Otherwise, GBP/USD may strengthen and reverse the short-term trend to bullish. A breakout and an upward retest of 1.1029 will create a good entry point to sell the pair with the downward target at 1.0955. This will pave the way to 1.0876. The low of 1.0800 will serve as the most distant target where I recommend profit taking. If GBP/USD rises and bears are idle at 1.1108, buyers will return to the market as further decline will become very unlikely. If so, the pair may jump to the high of 1.1167, and only its false breakout will form an entry point for going short, considering its further decline. If nothing happens there as well, I would advise you to sell GBP/USD right after a rebound from 1.1222, keeping in mind a possible pullback of 30-35 pips within the day.

COT report:
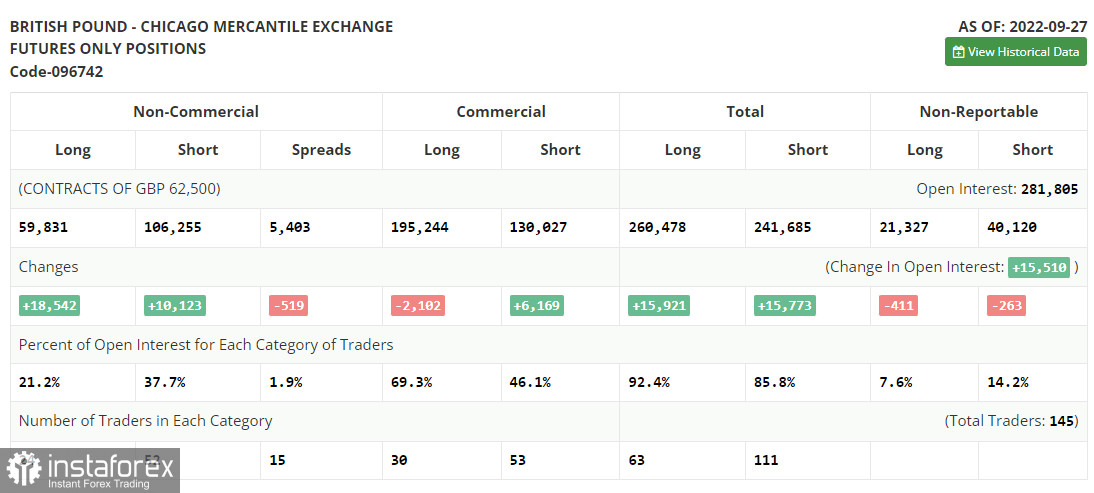
The Commitment of Traders report for September 27 showed a rapid rise in both long and short positions. The pound lost 10.0% in just two days, forcing the Bank of England to interfere. This explains the recovery of demand for the pound and the rise in long positions. As the Bank of England raised the rate by just 0.5%, the pound plummeted to record lows, making the scenario of hitting the parity level very real. Yet, the actions taken by the regulator in the bonds market helped steady the situation in the foreign exchange market and allowed bulls to recoup most of the losses. The question is how long these measures will keep the pound afloat. This week, the business activity data expected in the UK may significantly weaken the pound and limit its upside potential. According to the latest COT report, long positions of the non-commercial group of traders went up by 18,831 to 59,831 while short positions jumped by 10,123 to 106,255. As a result, the total non-commercial net position decreased to -46,424 from -54,843. The weekly closing price plunged and stood at 1.0738 versus 1.1392.

Indicator signals:
Moving Averages
Trading below the 30- and 50-day moving averages indicates that bears are still in control of the market.
Please note that the time period and levels of the moving averages are analyzed only for the H1 chart, which differs from the general definition of the classic daily moving averages on the D1 chart.
Bollinger Bands
In case of an upward movement, the upper band of the indicator at 1.1167 will serve as resistance.
Description of indicators:
• A moving average of a 50-day period determines the current trend by smoothing volatility and noise; marked in yellow on the chart;
• A moving average of a 30-day period determines the current trend by smoothing volatility and noise; marked in green on the chart;
• MACD Indicator (Moving Average Convergence/Divergence) Fast EMA with a 12-day period; Slow EMA with a 26-day period. SMA with a 9-day period;
• Bollinger Bands: 20-day period;
• Non-commercial traders are speculators such as individual traders, hedge funds, and large institutions who use the futures market for speculative purposes and meet certain requirements;
• Long non-commercial positions represent the total number of long positions opened by non-commercial traders;
• Short non-commercial positions represent the total number of short positions opened by non-commercial traders;
• The non-commercial net position is the difference between short and long positions of non-commercial traders.
 English
 Русский
 Bahasa Indonesia
 Bahasa Malay
 ไทย
ไทย Español
 Deutsch
 Български
 Français
 Tiếng Việt
 中文
中文 বাংলা
বাংলা हिन्दी
 Čeština
 Українська
 Română

