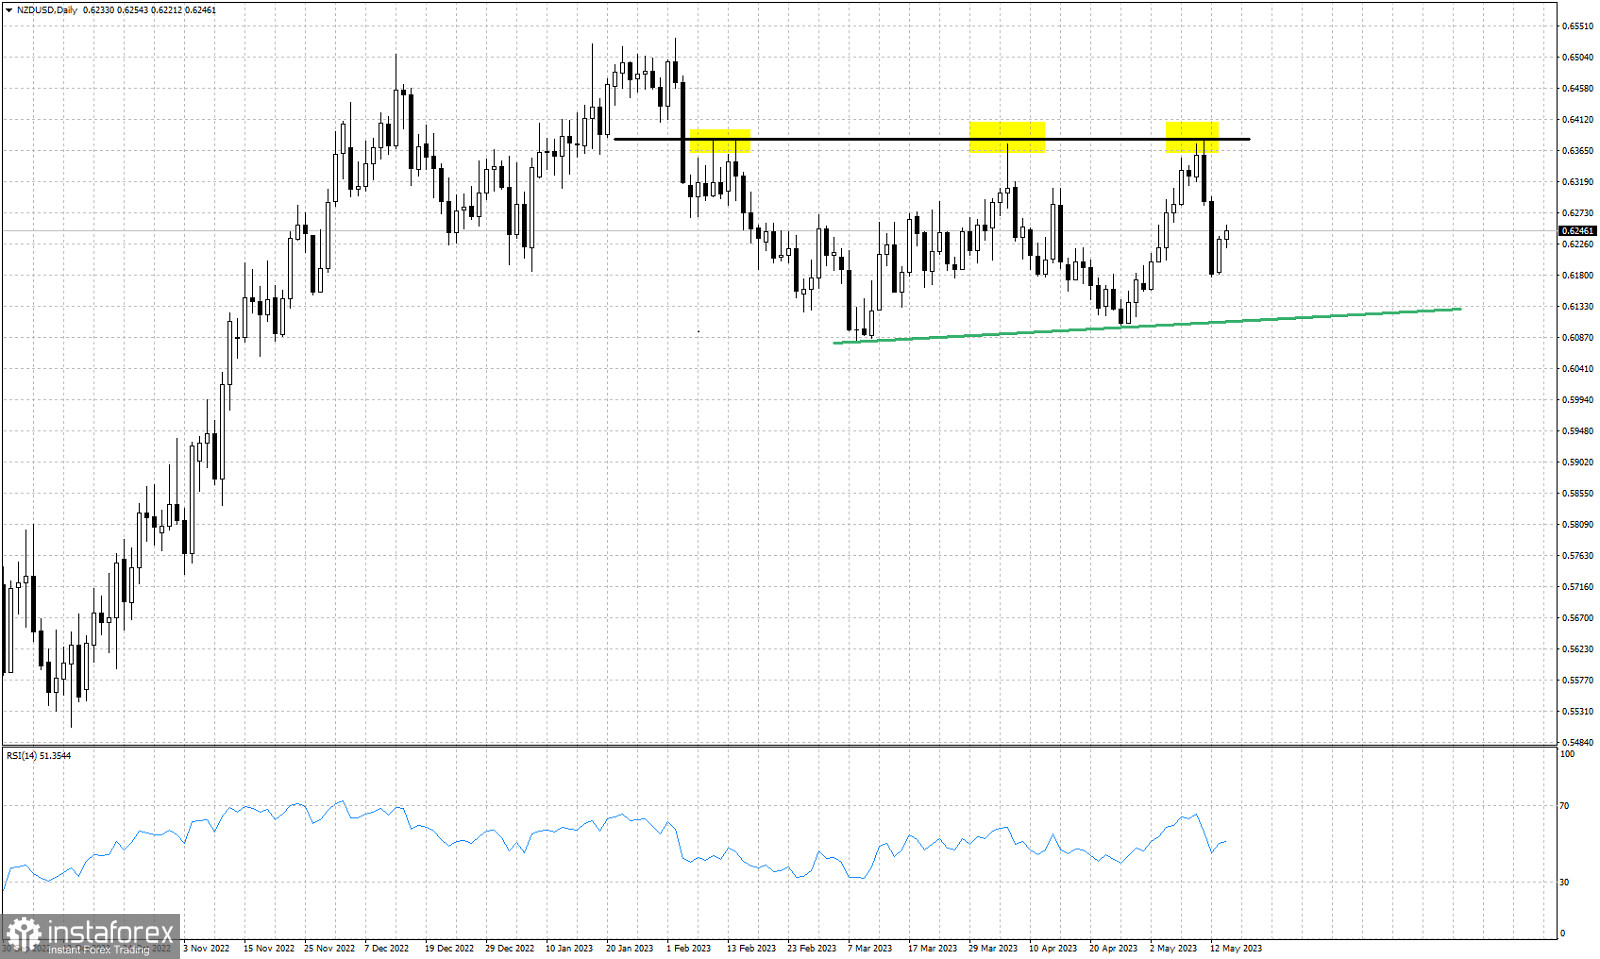
Black line -resistance trend line
Green line- support trend line
Yellow rectangles- rejections
NZDUSD is trading around 0.6230. Recent price action has confirmed the importance of the resistance at 0.6380. Price reached for the third time this price level and got rejected once again. Price is now under pressure again but continues to hold above the horizontal support trend line at 0.6109. Price is mostly moving sideways over the last few months with no clear direction. A trading range between 0.61 and 0.6370 has been formed. Traders better be cautious and patient. Better wait for a break out above or below the key resistance and support levels. The RSI is in the middle of its range also confirming the indecisiveness of the trend.
 English
 Русский
 Bahasa Indonesia
 Bahasa Malay
 ไทย
ไทย Español
 Deutsch
 Български
 Français
 Tiếng Việt
 中文
中文 বাংলা
বাংলা हिन्दी
 Čeština
 Українська
 Română

