USD/JPY:

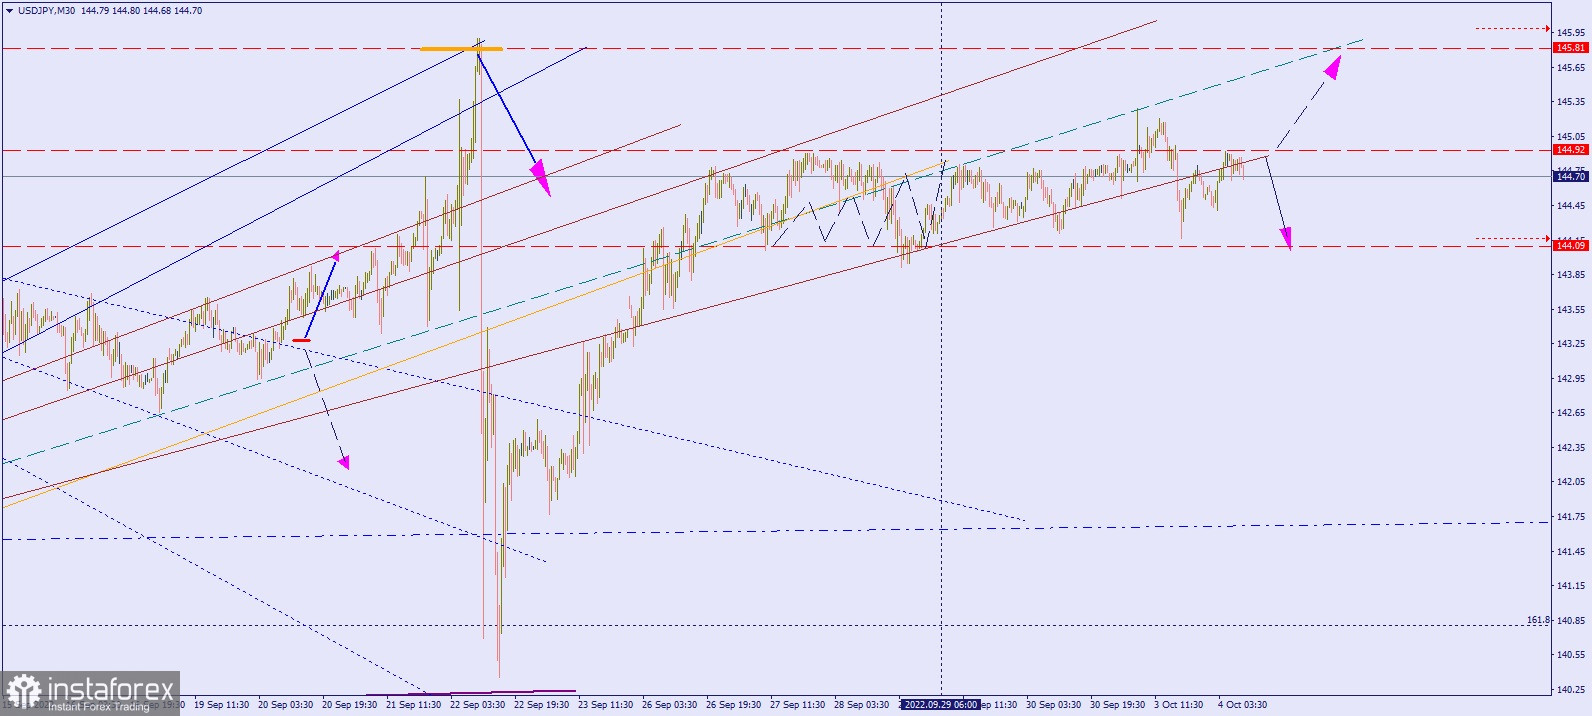
The chart shows the movement of USD/JPY in the 30-minute (M30) chart.
The sideways trend, in which the pair has been for almost a week, may end today.
If the quotes test the support level of £144.09 and breaks through it, the new target will be £143.00 per US dollar. But if it tests and breaks down the resistance level of £144.92, the pair will move up, breaking the downward trend.
Good luck!
 English
 Русский
 Bahasa Indonesia
 Bahasa Malay
 ไทย
ไทย Español
 Deutsch
 Български
 Français
 Tiếng Việt
 中文
中文 বাংলা
বাংলা हिन्दी
 Čeština
 Українська
 Română

