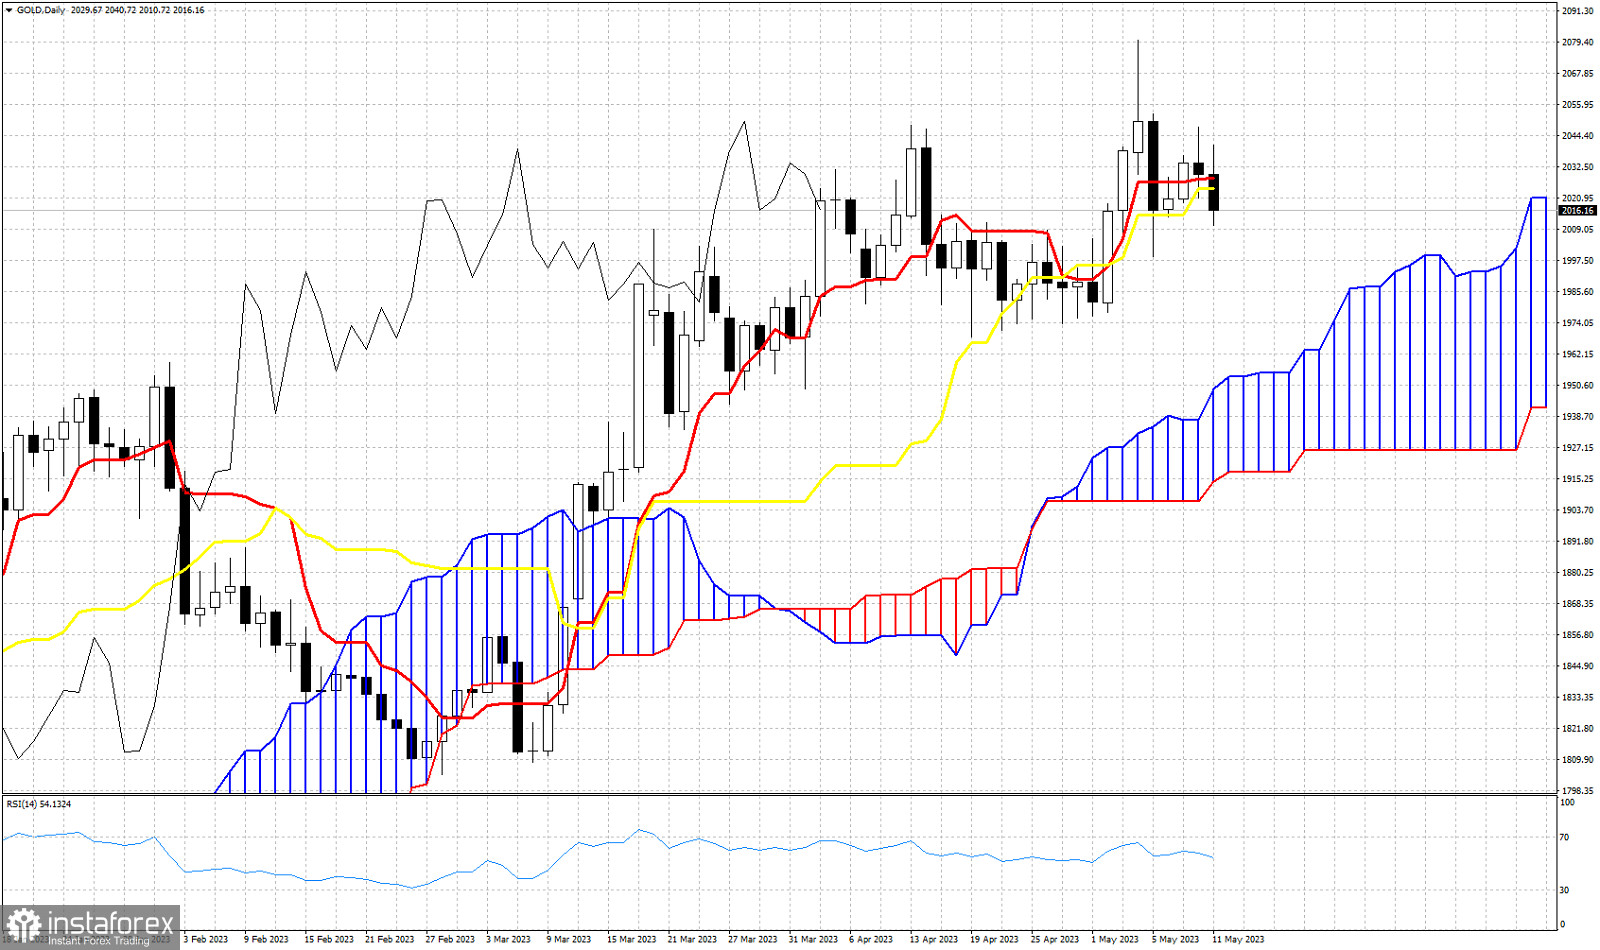
Gold price is trading above the Ichimoku cloud. In Ichimoku cloud terms trend is bullish. However with price breaking below the tenkan-sen (red line indicator) and the kijun-sen (yellow line indicator), we get some warnings of a potential move lower. The Chikou span (black line indicator) is close to breaking below the candlestick pattern. This would be bearish. A daily close below $2,024 would be a sign of weakness and will make us expect price to move lower towards recent lows of $1,973. A test of cloud support is justified at current levels and highly likely. If the tenkan-sen crosses below the kijun-sen, then we will get another bearish signal.
 English
 Русский
 Bahasa Indonesia
 Bahasa Malay
 ไทย
ไทย Español
 Deutsch
 Български
 Français
 Tiếng Việt
 中文
中文 বাংলা
বাংলা हिन्दी
 Čeština
 Українська
 Română

