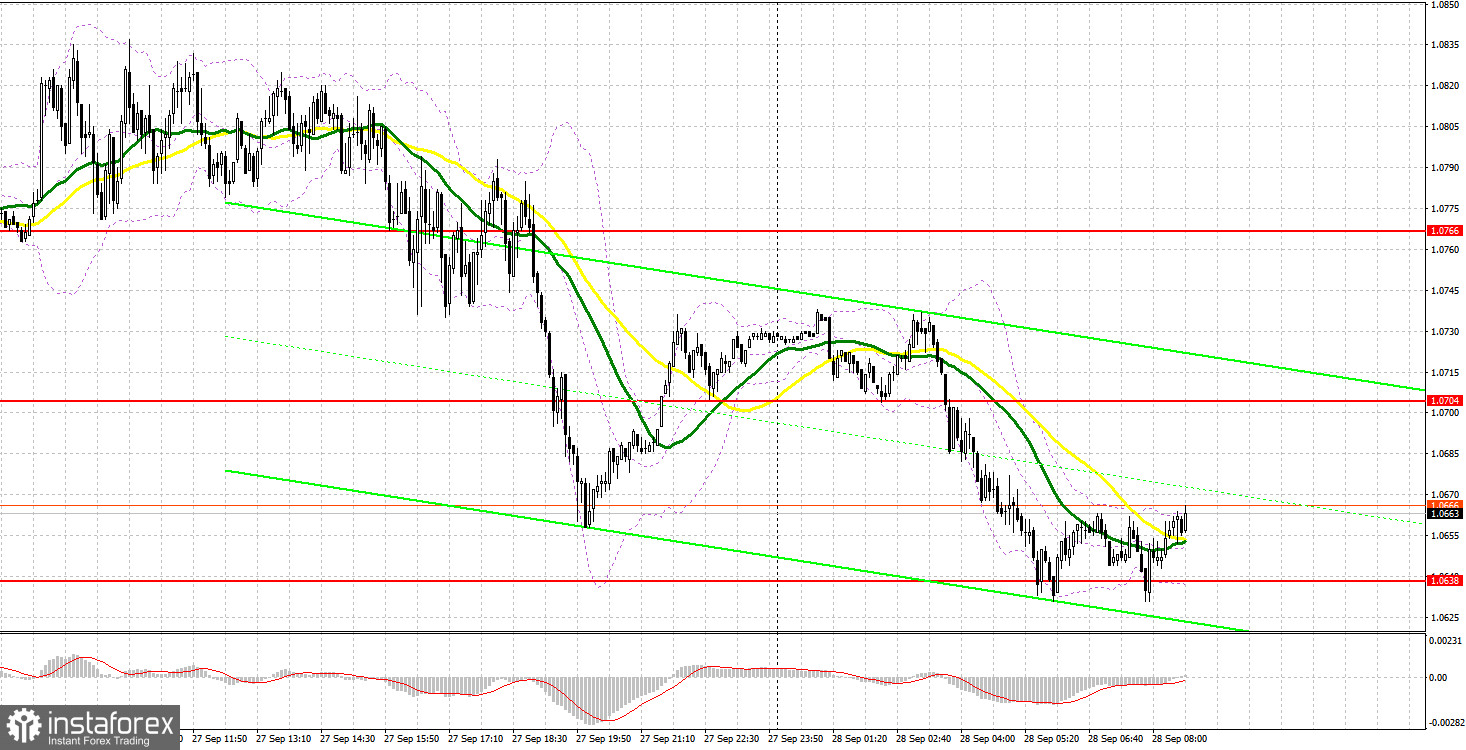
I did not wait for normal signals to enter the market. Let's take a look at the 5-minute chart and see what happened. The sharp decline in the pound's volatility has seriously affected the market situation. I paid attention to the 1.0766 level in my morning forecast and advised making decisions on entering the market from it. The GBP/USD pair fell at the beginning of the European session, but we fell short of reaching 1.0766 by just a couple of points - there was not enough fundamental statistics. It was not possible to get an entry point to the market for this reason. In the afternoon, even though the bears reached 1.0766, the level was rather "smeared", so it was not possible to get a normal entry point there.

When to go long on GBP/USD:
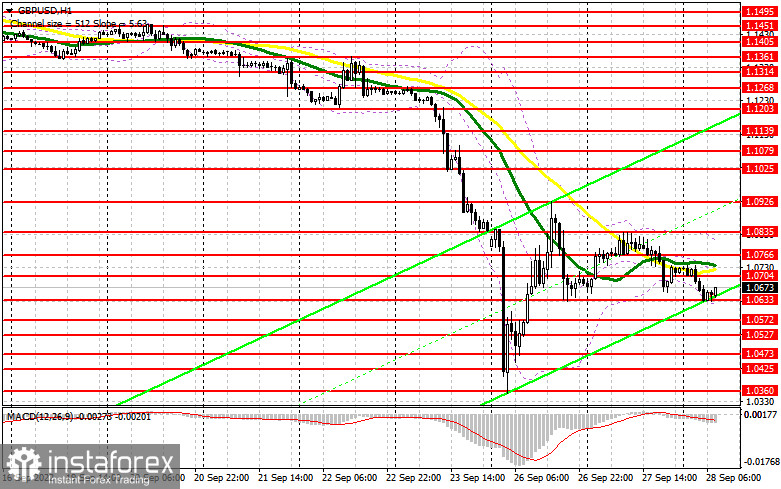
The pair sank quite well during today's Asian session, updating yesterday's lows. It looks like the pressure on the British pound is gradually returning, especially amid the political upheavals that are now taking place in the UK. The point is that, on the one hand, the new prime minister of Great Britain is trying with all her might to promote packages of assistance to the population and the economy, and on the other hand, the Bank of England, with all its might, "tightens the screws" in order to at least do something with inflation, which, according to it, forecast to reach the 13% level by the end of the year. This does not add optimism to the bulls on the pound. Given that there is no reason to buy, I advise you to act very carefully and best of all on a decline. Only a false breakout in the area of 1.0633 will provide a signal to open long positions in order to recover to the resistance of 1.0704, in the area of which the moving averages are moving, playing on the bears' side. A breakthrough and a downward test of this range may pull speculators' stop-orders along with it, which creates a new buy signal with an increase to a more distant level of 1.0766. The most desirable target for the bulls will be the area of 1.0835, where I recommend taking profits. Considering that only a speech by BoE Deputy Governor for Financial Stability Jon Cunliff is scheduled for today, it is unlikely that anything will help the pound recover like this.
If the GBP/USD falls and there are no bulls at 1.0633, and most likely it will be so, the pair will be under pressure again, which will open up the prospect of updating the low of 1.0572. I recommend opening long positions on GBP/USD immediately for a rebound from 1.0527, or even lower - around 1.0473, counting on correcting 30-35 points within the day.
When to go short on GBP/USD:
The bears are gradually regaining control of the market after the pound's sharp upward move earlier in the week. Of course, the best sell scenario would be a false breakout from 1.0704. This level acts as a kind of upper limit of the short-term downward channel formed on Monday after the pound bounced up. But in order for the bears to really declare themselves, they need to take the initiative below 1.0633. A reverse test from the bottom up of this range will provide a good entry point for short positions with the goal of a new major sell-off to the 1.0572 area, and there it is within easy reach to 1.0527. The farthest target will be at least 1.0473, where I recommend taking profits.
In case GBP/USD grows and the bears are not active at 1.0704, the correction may bring the pair back to the 1.0766 area. Only a false breakout at this level will provide an entry point into short positions with the goal of further downward movement of the pair. If there is no activity there, I advise you to sell GBP/USD immediately for a rebound from 1.0835, counting on the pair's rebound down by 30-35 points within the day.

COT report:
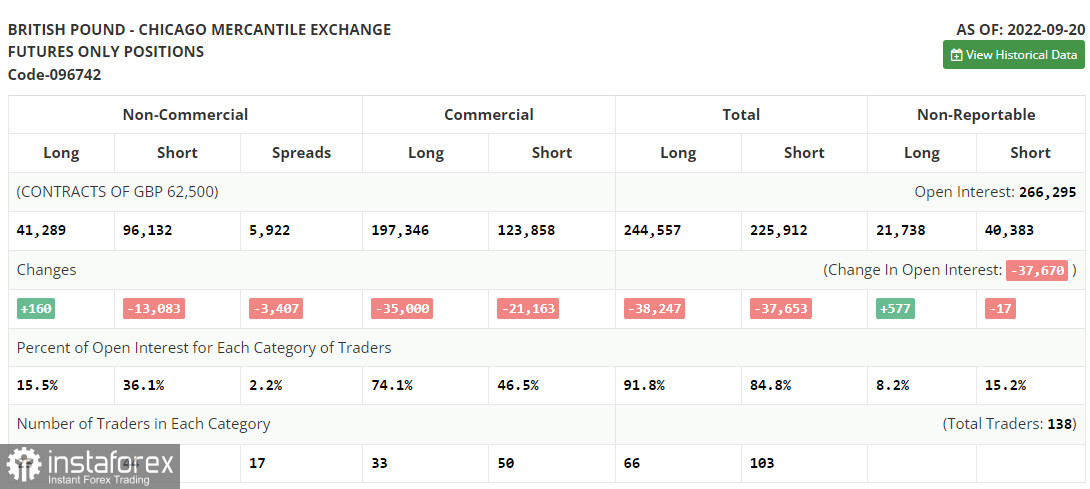
The Commitment of Traders (COT) report for September 20 logged an increase in long positions, and a decrease in short ones. However, this report clearly does not take into account what is currently happening in the market in reality, so there is no need to pay much attention to it. The changes that took place in just a few days in the UK are now dictating the pair's direction. Last week, the BoE raised interest rates by only 0.5% and apparently already regrets it, since after that the Ministry of Finance announced that they were ready to provide another unprecedented assistance to households to cope with high energy prices, and also announced very large tax cuts to support and stimulate the economy. However, they forgot to mention that this will also further accelerate inflation, which the BoE has not yet been able to cope with very well. This provoked a sell-off of the pound by almost 1,000 points in two days. Investors took advantage of this moment and the well-depreciated pound, and bought it off, however, it is still difficult to say that the market eventually found the bottom. This week there are a lot of statistics on the US, which can return pressure on the GBP/USD pair. The latest COT report indicated that long non-commercial positions rose by 160 to 41,289, while short non-commercial positions decreased by 13,083 to 96,132, resulting in a slight reduction in the negative non-commercial net position to -54,843 against -68,086. The weekly closing price fell off from 1.1392 against 1.1504.

Indicator signals:
Trading is below the 30 and 50-day moving averages, indicating a continuation of the bear market.
Moving averages
Note: The period and prices of moving averages are considered by the author on the H1 hourly chart and differs from the general definition of the classic daily moving averages on the daily D1 chart.
Bollinger Bands
In case of growth, the average border of the indicator around 1.0820 will act as resistance.
Description of indicators
- Moving average (moving average, determines the current trend by smoothing out volatility and noise). Period 50. It is marked in yellow on the chart.
- Moving average (moving average, determines the current trend by smoothing out volatility and noise). Period 30. It is marked in green on the chart.
- MACD indicator (Moving Average Convergence/Divergence — convergence/divergence of moving averages) Quick EMA period 12. Slow EMA period to 26. SMA period 9
- Bollinger Bands (Bollinger Bands). Period 20
- Non-commercial speculative traders, such as individual traders, hedge funds, and large institutions that use the futures market for speculative purposes and meet certain requirements.
- Long non-commercial positions represent the total long open position of non-commercial traders.
- Short non-commercial positions represent the total short open position of non-commercial traders.
- Total non-commercial net position is the difference between short and long positions of non-commercial traders.
 English
 Русский
 Bahasa Indonesia
 Bahasa Malay
 ไทย
ไทย Español
 Deutsch
 Български
 Français
 Tiếng Việt
 中文
中文 বাংলা
বাংলা हिन्दी
 Čeština
 Українська
 Română

