 English
  Русский
 Bahasa Indonesia
 Bahasa Malay
 ไทย
ไทย Español
 Deutsch
 Български
 Français
 Tiếng Việt
 中文
中文 বাংলা
বাংলা हिन्दी
 Čeština
 Українська
 Română

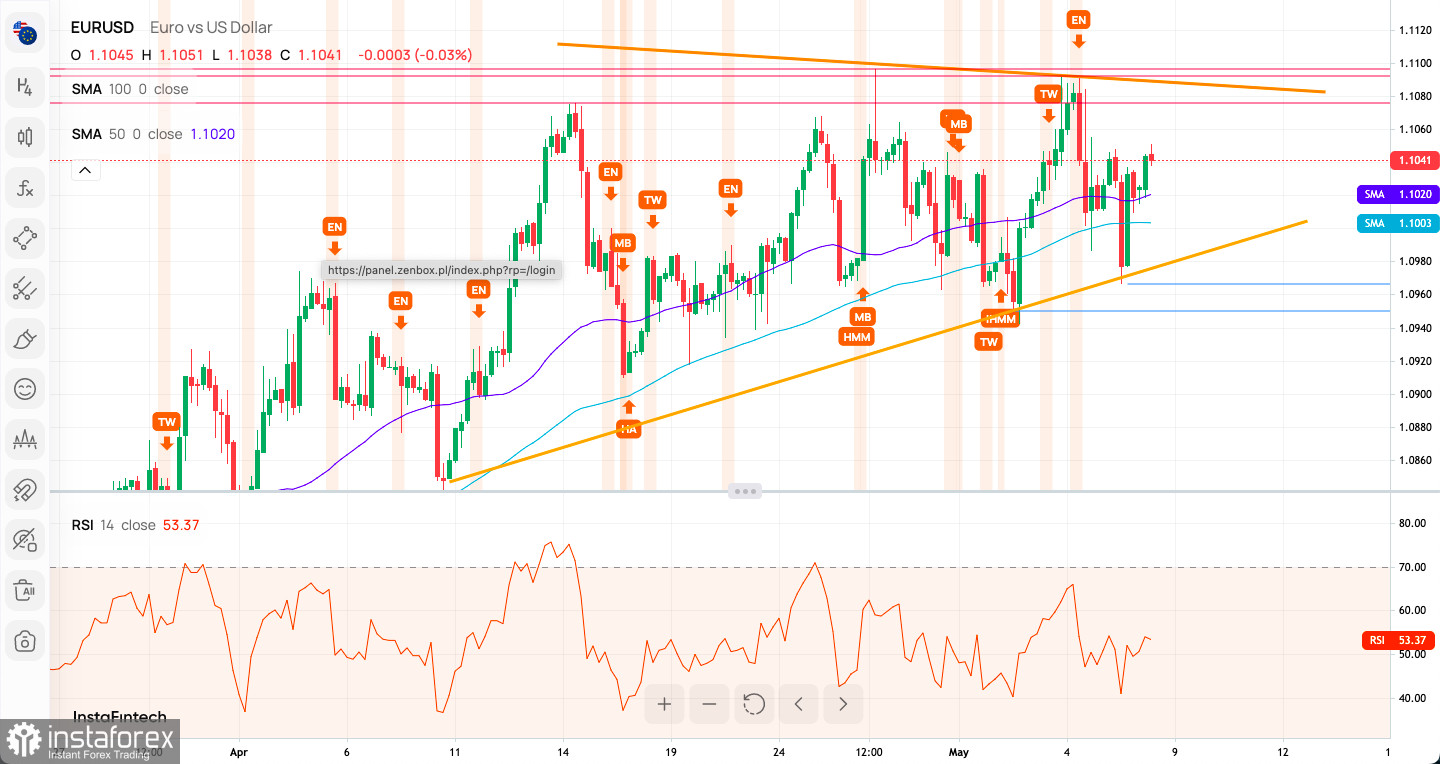
Technical Market Outlook:
The EUR/USD pair has been seen developing the possible Falling Wedge pattern on the H4 time frame chart. The key short-term technical support is seen at the level of 1.0910 and any breakout below this level would be a bearish pressure indication. The momentum is positive on the H4 time frame chart, so the market is ready yet to continue the up trend towards the level of 1.1185 (swing high from 31st March 2022) or even towards 1.1280, which is 61% Fibonacci retracement level of the whole, big wave down that started in January 2021. Please notice, that the developing of the potential Falling Wedge pattern might take some time, but the downside breakout should be aggressive and dynamic.
Weekly Pivot Points:
WR3 - 1.11092
WR2 - 1.10728
WR1 - 1.10590
Weekly Pivot - 1.10364
WS1 - 1.10226
WS2 - 1.10000
WS3 - 1.09636
Trading Outlook:
Since the beginning of October 2022 the EUR/USD is in the corrective cycle to the upside, but the main, long-term trend remains bearish. This corrective cycle might had been terminated at the level of 1.2080 which is 61% Fibonacci retracement level. The EUR had made a new multi-decade low at the level of 0.9538, so as long as the USD is being bought all across the board, the down trend will continue towards the new lows.