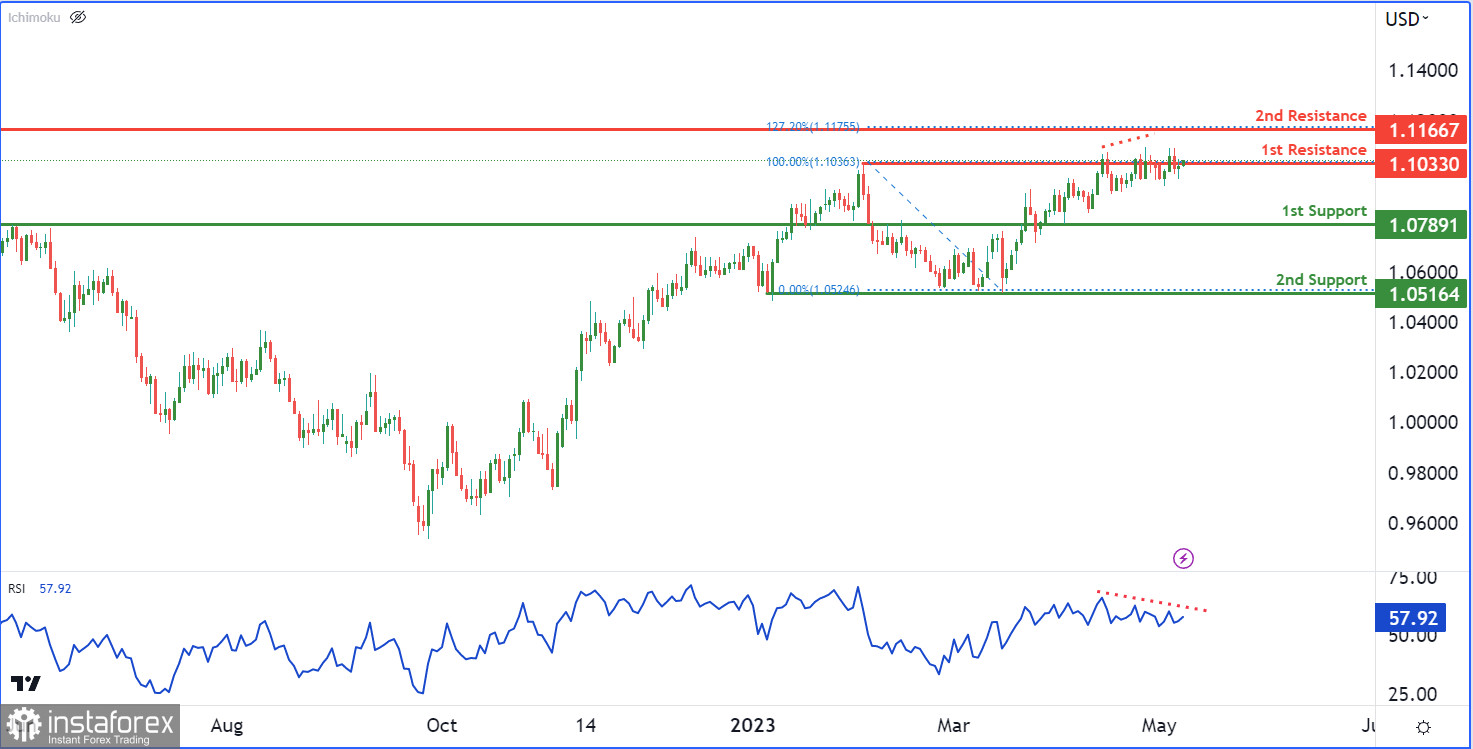
The EUR/USD chart currently exhibits bearish momentum, which suggests that prices may decline in the short term. The fact that the price is below the Ichimoku cloud further reinforces this bearish signal.
The first resistance level for the EUR/USD chart is at 1.1033, which is a multi-swing high resistance level. This level serves as a potential point for the price to react and potentially drop towards the first support level at 1.0789, which is an overlap support level. If prices break below this support level, they could potentially drop even further towards the second support level at 1.0516, which is also significant as it is a multi-swing low support level.
On the other hand, if the price breaks above the first resistance level at 1.1033, it could potentially rise towards the second resistance level at 1.1166, which is an overlap resistance level. This level is also significant as it could act as a potential resistance point for prices.
It's worth noting that the RSI is exhibiting bearish divergence versus price, indicating that a reversal might occur soon.

 English
 Русский
 Bahasa Indonesia
 Bahasa Malay
 ไทย
ไทย Español
 Deutsch
 Български
 Français
 Tiếng Việt
 中文
中文 বাংলা
বাংলা हिन्दी
 Čeština
 Українська
 Română

