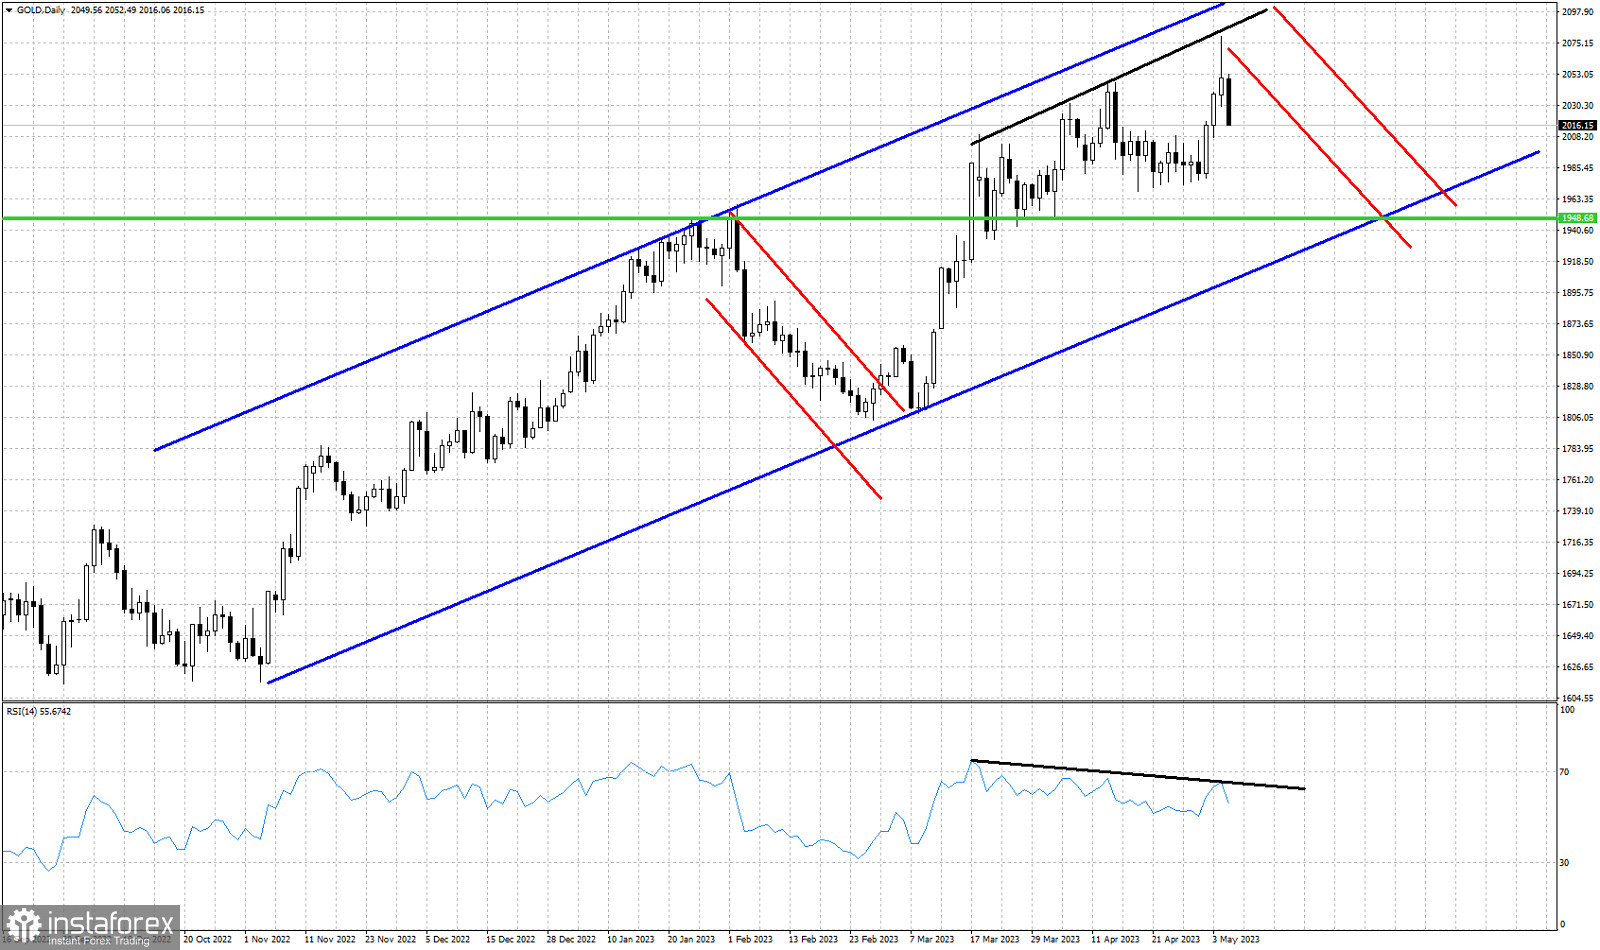
Blue lines-bullish channel
Red lines- bearish potential
Black lines- bearish RSI divergence
Green line- important horizontal support
Gold is under pressure. Gold is trading close to $2,010. In our previous analysis we noted the increased chances of an important top in the making and the start of a pull back that could bring price towards $1,950-$1,920 area. Gold price remains inside the medium-term bullish channel, but this does not mean that in the near term we can not see a pull back. The strengthening of the Dollar after today's NFP numbers has hit Gold price. The new higher high made yesterday at $2,080 was followed by another bearish RSI divergence. We warned on time that the up trend was weakening and the RSI suggested that there was limited upside potential. Next key short-term support is at $1,977 and a break below it will open the way for a deeper correction towards the lower channel boundary.
 English
 Русский
 Bahasa Indonesia
 Bahasa Malay
 ไทย
ไทย Español
 Deutsch
 Български
 Français
 Tiếng Việt
 中文
中文 বাংলা
বাংলা हिन्दी
 Čeština
 Українська
 Română

