USD/JPY:

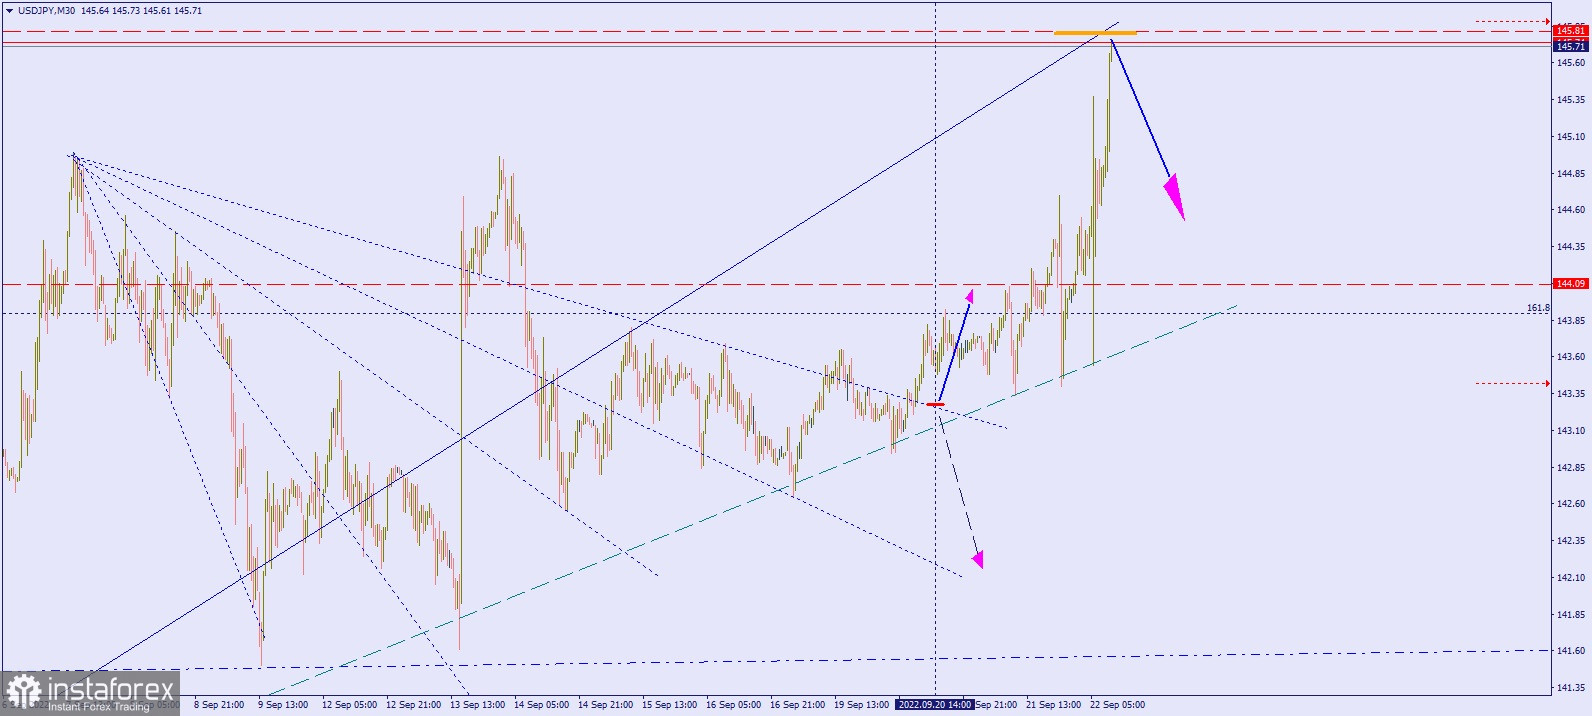
The chart shows the movement of USD/JPY in the 30-minute (M30) chart.
Comparing the recent price movement to that of September 20's, it is clear that the pair rose and hit the key resistance level of £145.85. Since this is also the highest record set in July 1998, a strong rebound is possible in the market.
Good luck!
 English
 Русский
 Bahasa Indonesia
 Bahasa Malay
 ไทย
ไทย Español
 Deutsch
 Български
 Français
 Tiếng Việt
 中文
中文 বাংলা
বাংলা हिन्दी
 Čeština
 Українська
 Română

