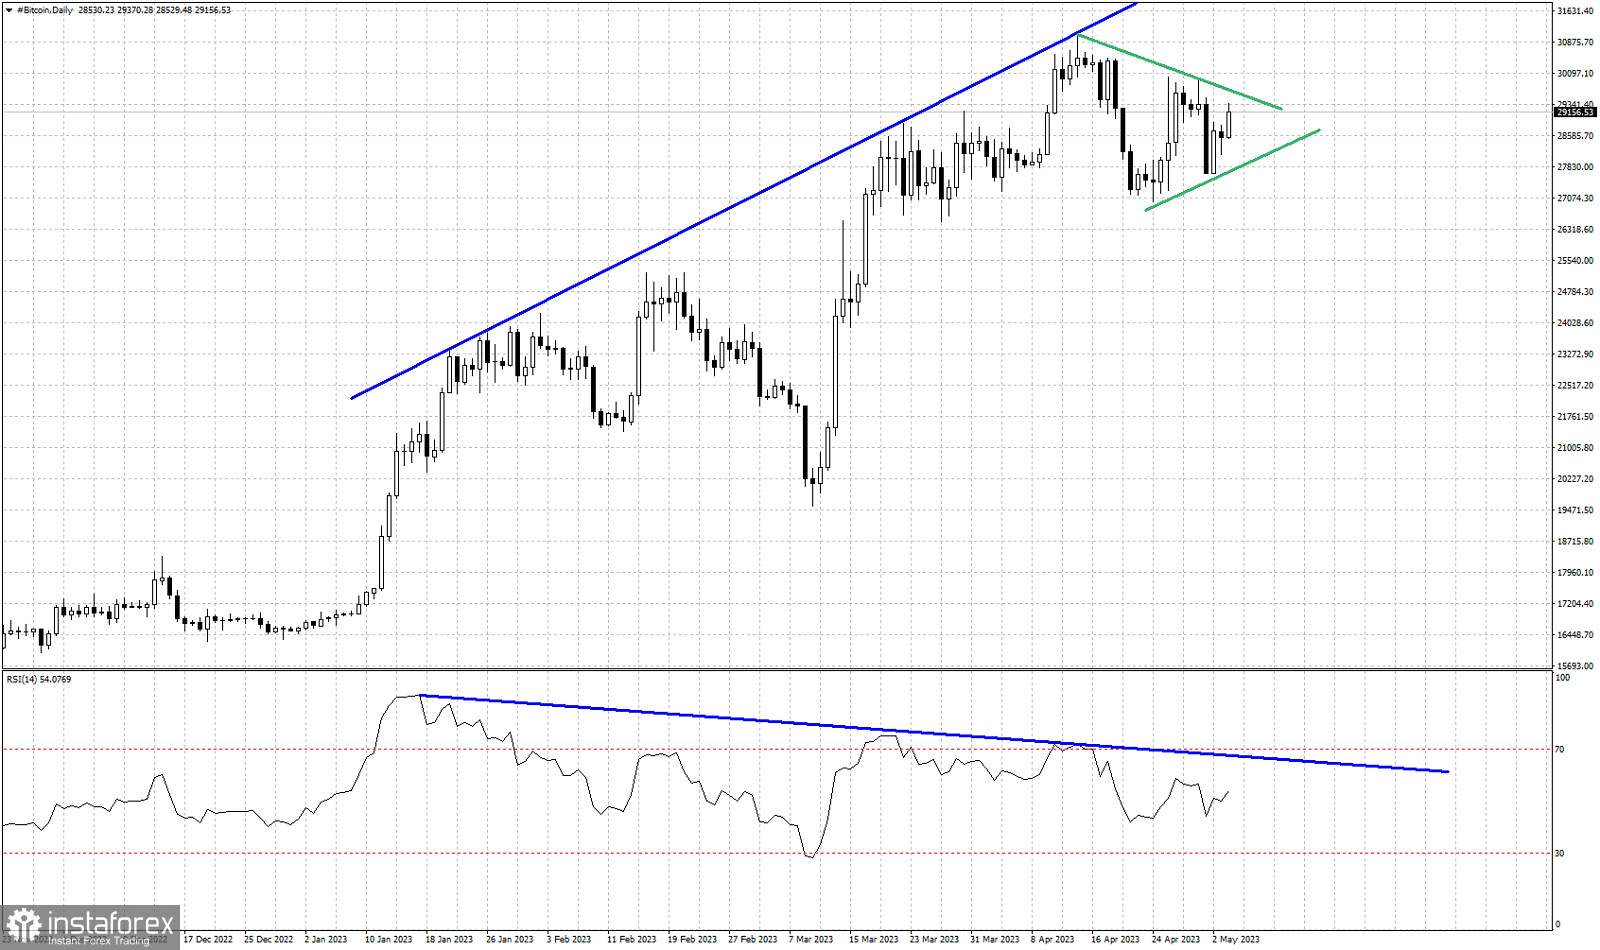
Blue lines- bearish RSI divergence
Green lines- Triangle pattern
Bitcoin is trading around $29,132. Price is mostly moving sideways over the last few sessions with price having formed a triangle pattern. This sideways consolidation will maximum run another 8-9 days before price runs out of space or breaks out of the triangle pattern. The resistance by the upper triangle boundary is at $29,705 and support by the lower triangle boundary at $27,745. The RSI bearish divergence has already warned us for a possible trend reversal. A beak below the triangle pattern will increase chances for the start of this coming reversal. A break above resistance will open the way for a bounce higher towards $33,000-$34,000.
 English
 Русский
 Bahasa Indonesia
 Bahasa Malay
 ไทย
ไทย Español
 Deutsch
 Български
 Français
 Tiếng Việt
 中文
中文 বাংলা
বাংলা हिन्दी
 Čeština
 Українська
 Română

