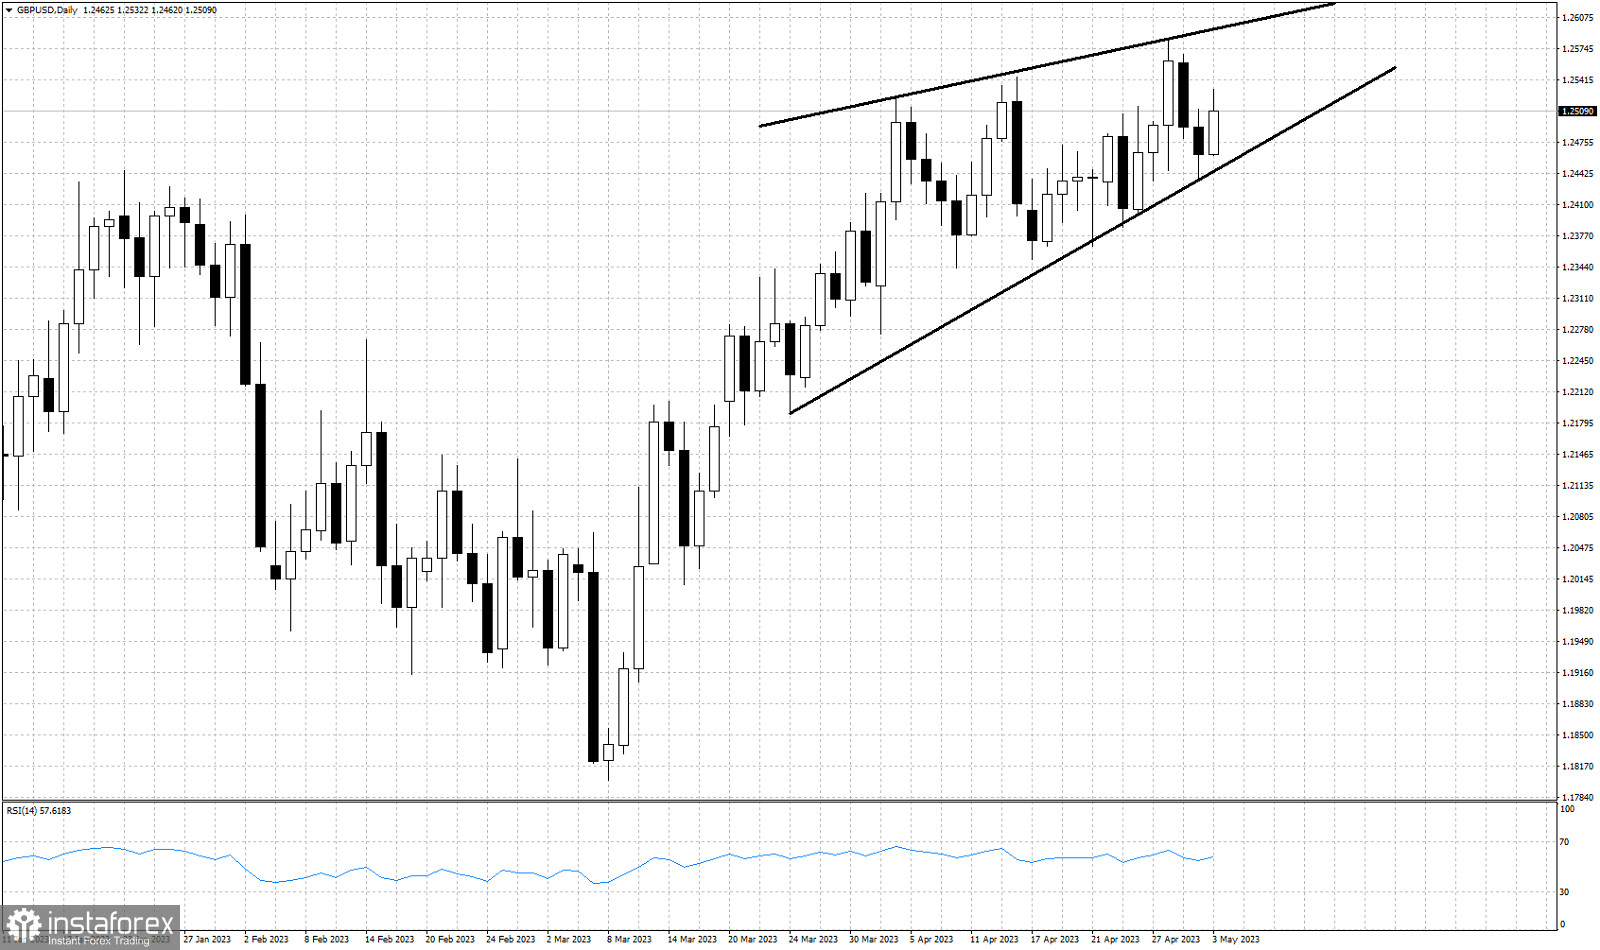
Black lines- wedge pattern
GBPUSD is trading around 1.25. Trend remains bullish as price continues making higher highs and higher lows. However price has formed an upward sloping wedge pattern and as we approach the top end of the pattern the chances for a reversal increase. Apart from the wedge pattern we also have a warning by the Daily RSI. The RSI is not making higher highs, instead it provides bearish divergence signals. Support by the lower wedge boundary is at 1.2435. As long as price is above this level, bulls will remain in control of the trend. A break below this support, a bearish signal will be provided and the start of a pull back confirmed. Traders better be patient this week with the FOMC tonight and the NFP numbers on Friday.
 English
 Русский
 Bahasa Indonesia
 Bahasa Malay
 ไทย
ไทย Español
 Deutsch
 Български
 Français
 Tiếng Việt
 中文
中文 বাংলা
বাংলা हिन्दी
 Čeština
 Українська
 Română

