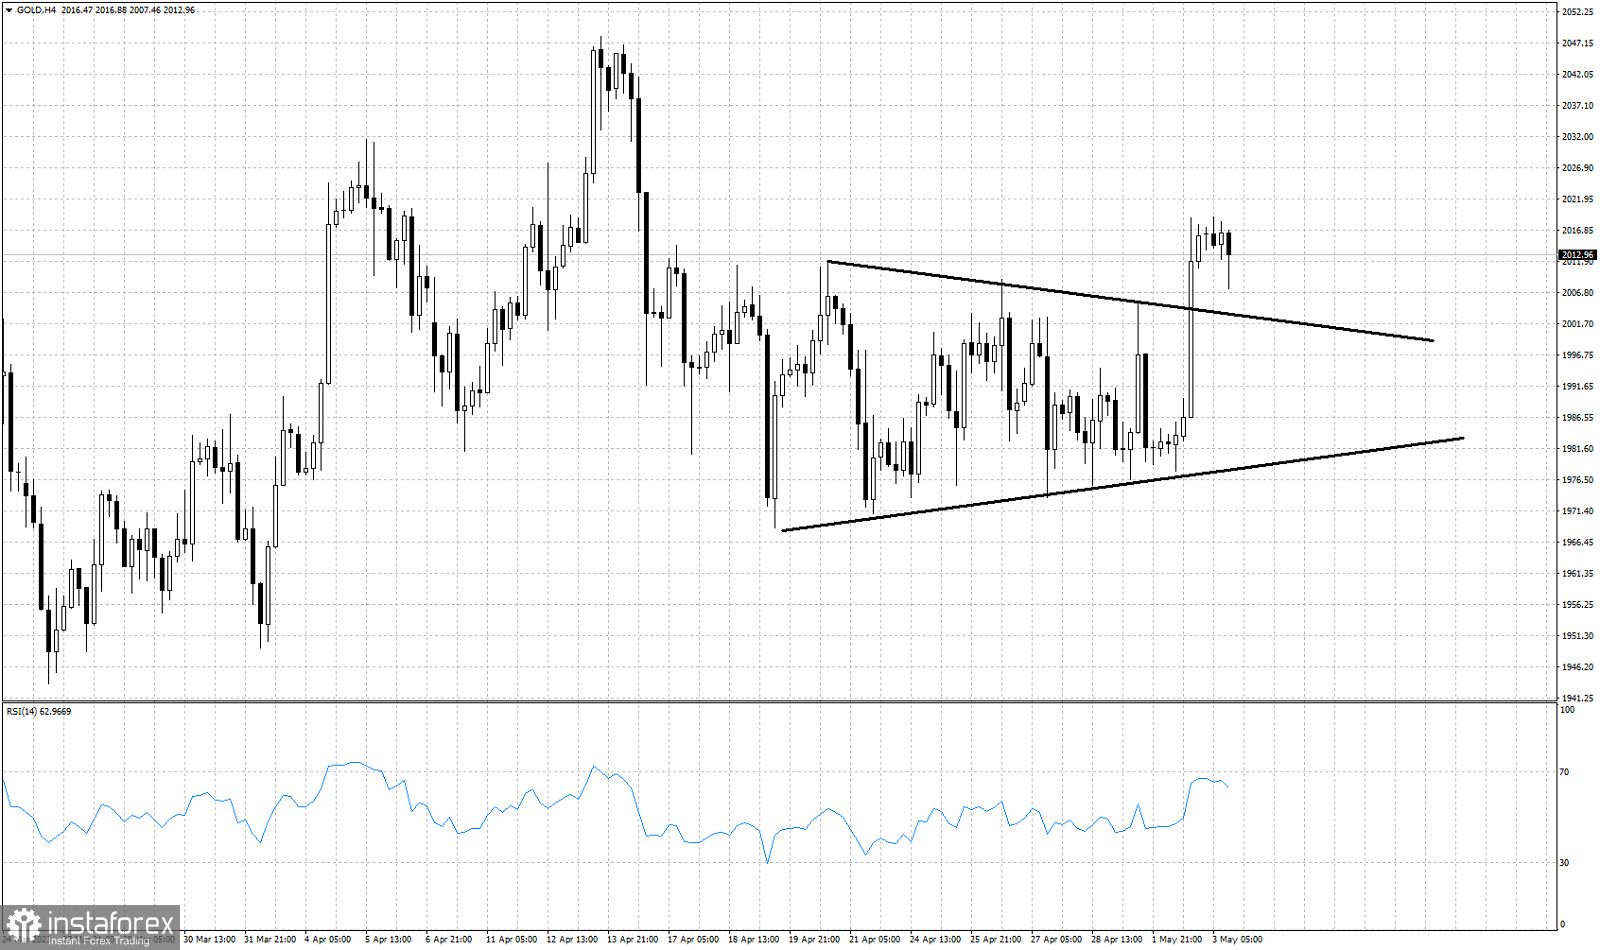
Black lines- triangle pattern (broken)
Gold price is trading above $2,000. Price broke out and above the triangle pattern it was in and reached as high as $2,018. Gold price provided a bullish signal with the break of the resistance at $2,004. Gold yesterday posted the highest daily close in two weeks. Previous resistance is now support. So Gold has support at the upper triangle boundary around $2,004. With price now at $2,012, we see Gold traders having a waiting stance for tonight's FOMC. Key support that if broken will cancel any bullish signal, is found at $1,977. As we mentioned yesterday, in order for bears to take control of the trend, Gold price must fall below recent lows of $1,977. If Gold price continues to consolidate around $2,010, then the most probable scenario is for Gold to eventually move higher.
 English
 Русский
 Bahasa Indonesia
 Bahasa Malay
 ไทย
ไทย Español
 Deutsch
 Български
 Français
 Tiếng Việt
 中文
中文 বাংলা
বাংলা हिन्दी
 Čeština
 Українська
 Română

