Details of the economic calendar for September 14
Annual inflation in the UK fell to 9.9% in August, with forecast of growth to 10.6% from 10.1%. The change is small, but this is a positive factor because the Bank of England at the upcoming meeting may well indicate a slowdown in the rate of inflation, which will affect the revision of the rate of increase in the refinancing rate.
Euro area industrial production declined to -2.4% YoY in July from the previous month's growth of 2.2%. Forecasts assumed growth of 1.7%. This is a negative factor, but the euro has already been heavily oversold. For this reason, there was no proper reaction on the market.
US producer prices recorded a decline from 9.8% to 8.7%. The market almost did not react to these statistics.
Analysis of trading charts from September 14
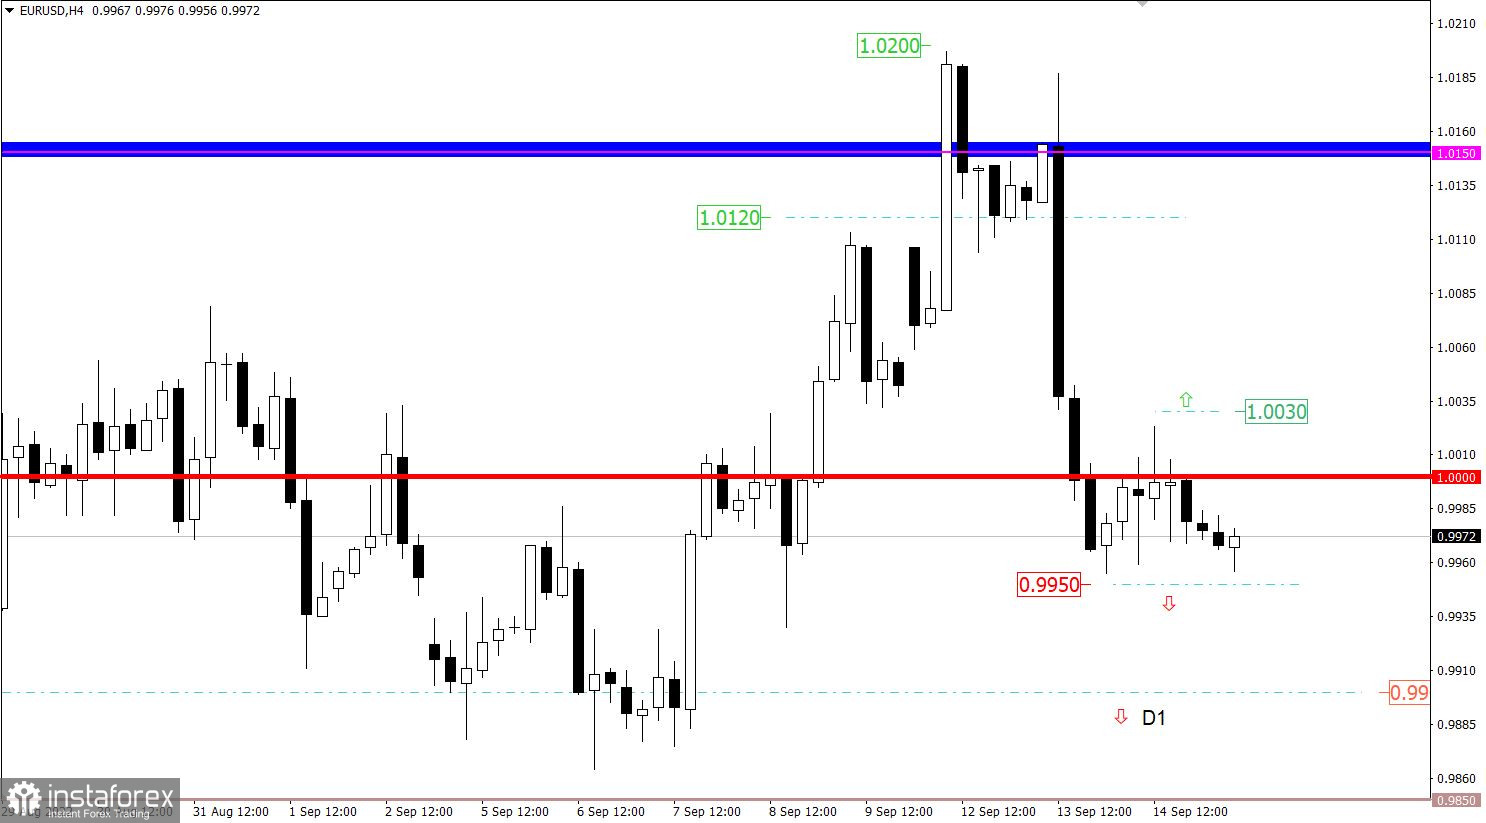
The EURUSD currency pair, despite the characteristic sign of oversold, continued to tread within the base of the recent downward momentum. As a result, a range of 50/60 points was formed.
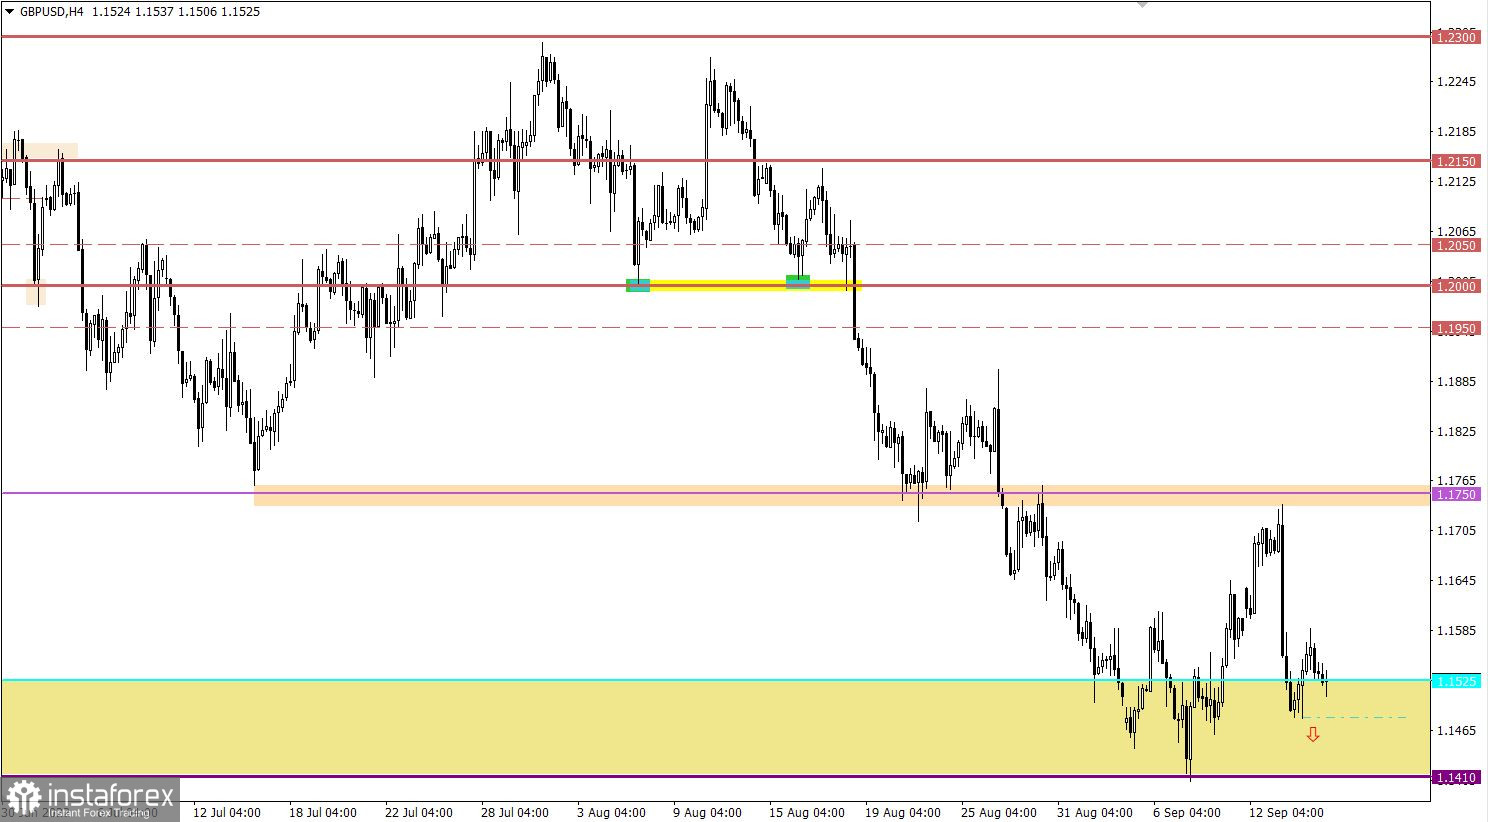
The GBPUSD currency pair reached 1.1588 at the stage of a pullback from the value of 1.1480, where there was a demand for dollar positions. As a result, the quote rushed back to the recent support level.

Economic calendar for September 15
Today the market is expecting data on the United States, where not the best indicators are predicted, which may have a negative impact on dollar positions.
US retail sales may fall from 10.3% to 9.0% YoY, while the volume of industrial production may slow down from 3.9% to 3.5% YoY. The negative for the US will not end there, as the weekly data on claims for benefits may reflect an increase.
Statistics details:
The volume of continuing claims for benefits may increase from 1.473 million to 1.475 million.
The volume of initial claims for benefits may increase from 222,000 to 226,000.
Time targeting:
US Retail Sales – 12:30 UTC
US Jobless Claims – 12:30 UTC
United States Industrial Production – 13:15 UTC
Trading plan for EUR/USD on September 15
In this situation, there is a process of accumulation of trading forces, which, in principle, restrains the quote from a full-scale pullback. The optimal trading tactic is considered to be the method of the impulse coming from the range of 0.9955/1.0010.
We concretize the above:
The downward move will be relevant after the price holds below 0.9950. This step may lead to an update of the low of the downward trend.
An upward movement in the currency pair is considered in case of a stable holding of the price above the value of 1.0030 in a four-hour period.

Trading plan for GBP/USD on September 15
In this situation, the signal for a subsequent decline will be the price holding below the 1.1480 mark in a four-hour period. This step is highly likely to lead to touching the 2020 low.
In your work, it is worth taking into account the factor of overheating of short positions in the pound sterling, where the recent pullback could not lead to a regrouping of trading forces. In this case, the lack of holding the price below 1.1480 may lead to a movement towards the values of 1.1588–1.1600.

What is shown in the trading charts?
A candlestick chart view is graphical rectangles of white and black light, with sticks on top and bottom. When analyzing each candle in detail, you will see its characteristics of a relative period: the opening price, closing price, and maximum and minimum prices.
Horizontal levels are price coordinates, relative to which a stop or a price reversal may occur. These levels are called support and resistance in the market.
Circles and rectangles are highlighted examples where the price of the story unfolded. This color selection indicates horizontal lines that may put pressure on the quote in the future.
The up/down arrows are the reference points of the possible price direction in the future.
 English
 Русский
 Bahasa Indonesia
 Bahasa Malay
 ไทย
ไทย Español
 Deutsch
 Български
 Français
 Tiếng Việt
 中文
中文 বাংলা
বাংলা हिन्दी
 Čeština
 Українська
 Română

