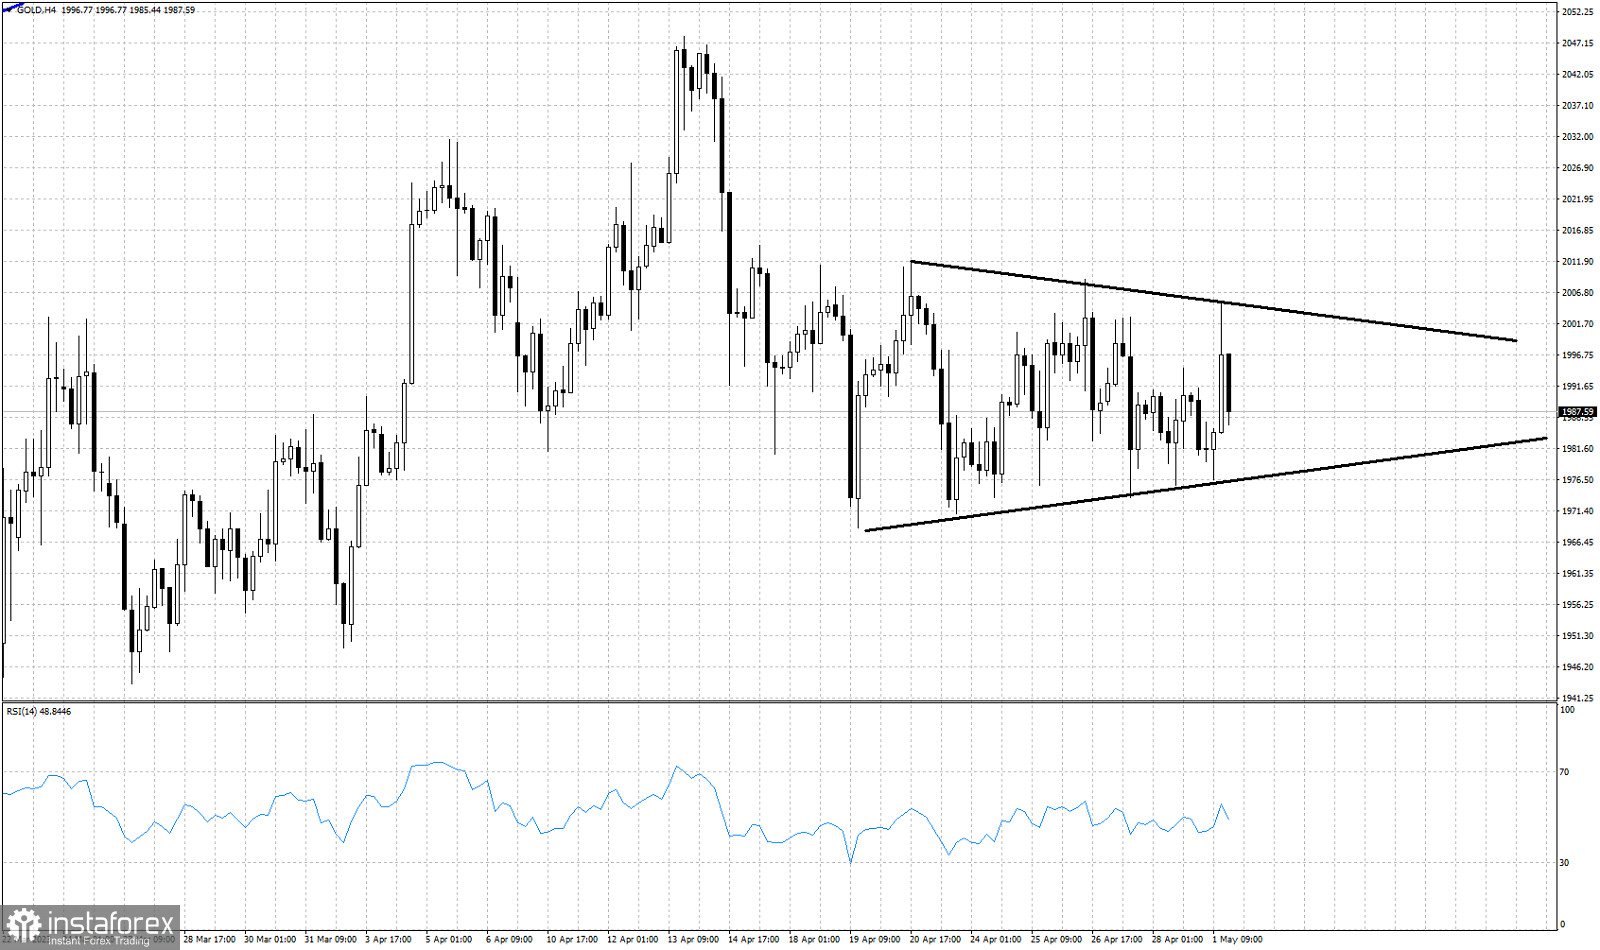
Black lines- triangle pattern
Gold price is under pressure again. Price is trading around $1,982. Price has made no real progress over the last two weeks as it has formed a triangle pattern with lower highs and higher lows. Short-term trend is unclear as long as price remains trapped inside the triangle. Earlier today Gold price bounced as high as $2,005 only to get rejected at the upper triangle boundary. Support by the lower triangle boundary is found at $1.976. Price is very close to the lower triangle support and only a break below it will produce a new bearish signal. That is why traders need to remain patient as long as Gold does not break any of the before mentioned triangle boundaries.
 English
 Русский
 Bahasa Indonesia
 Bahasa Malay
 ไทย
ไทย Español
 Deutsch
 Български
 Français
 Tiếng Việt
 中文
中文 বাংলা
বাংলা हिन्दी
 Čeština
 Українська
 Română

